
Fig. 5. Disease-Predominant Pathways.
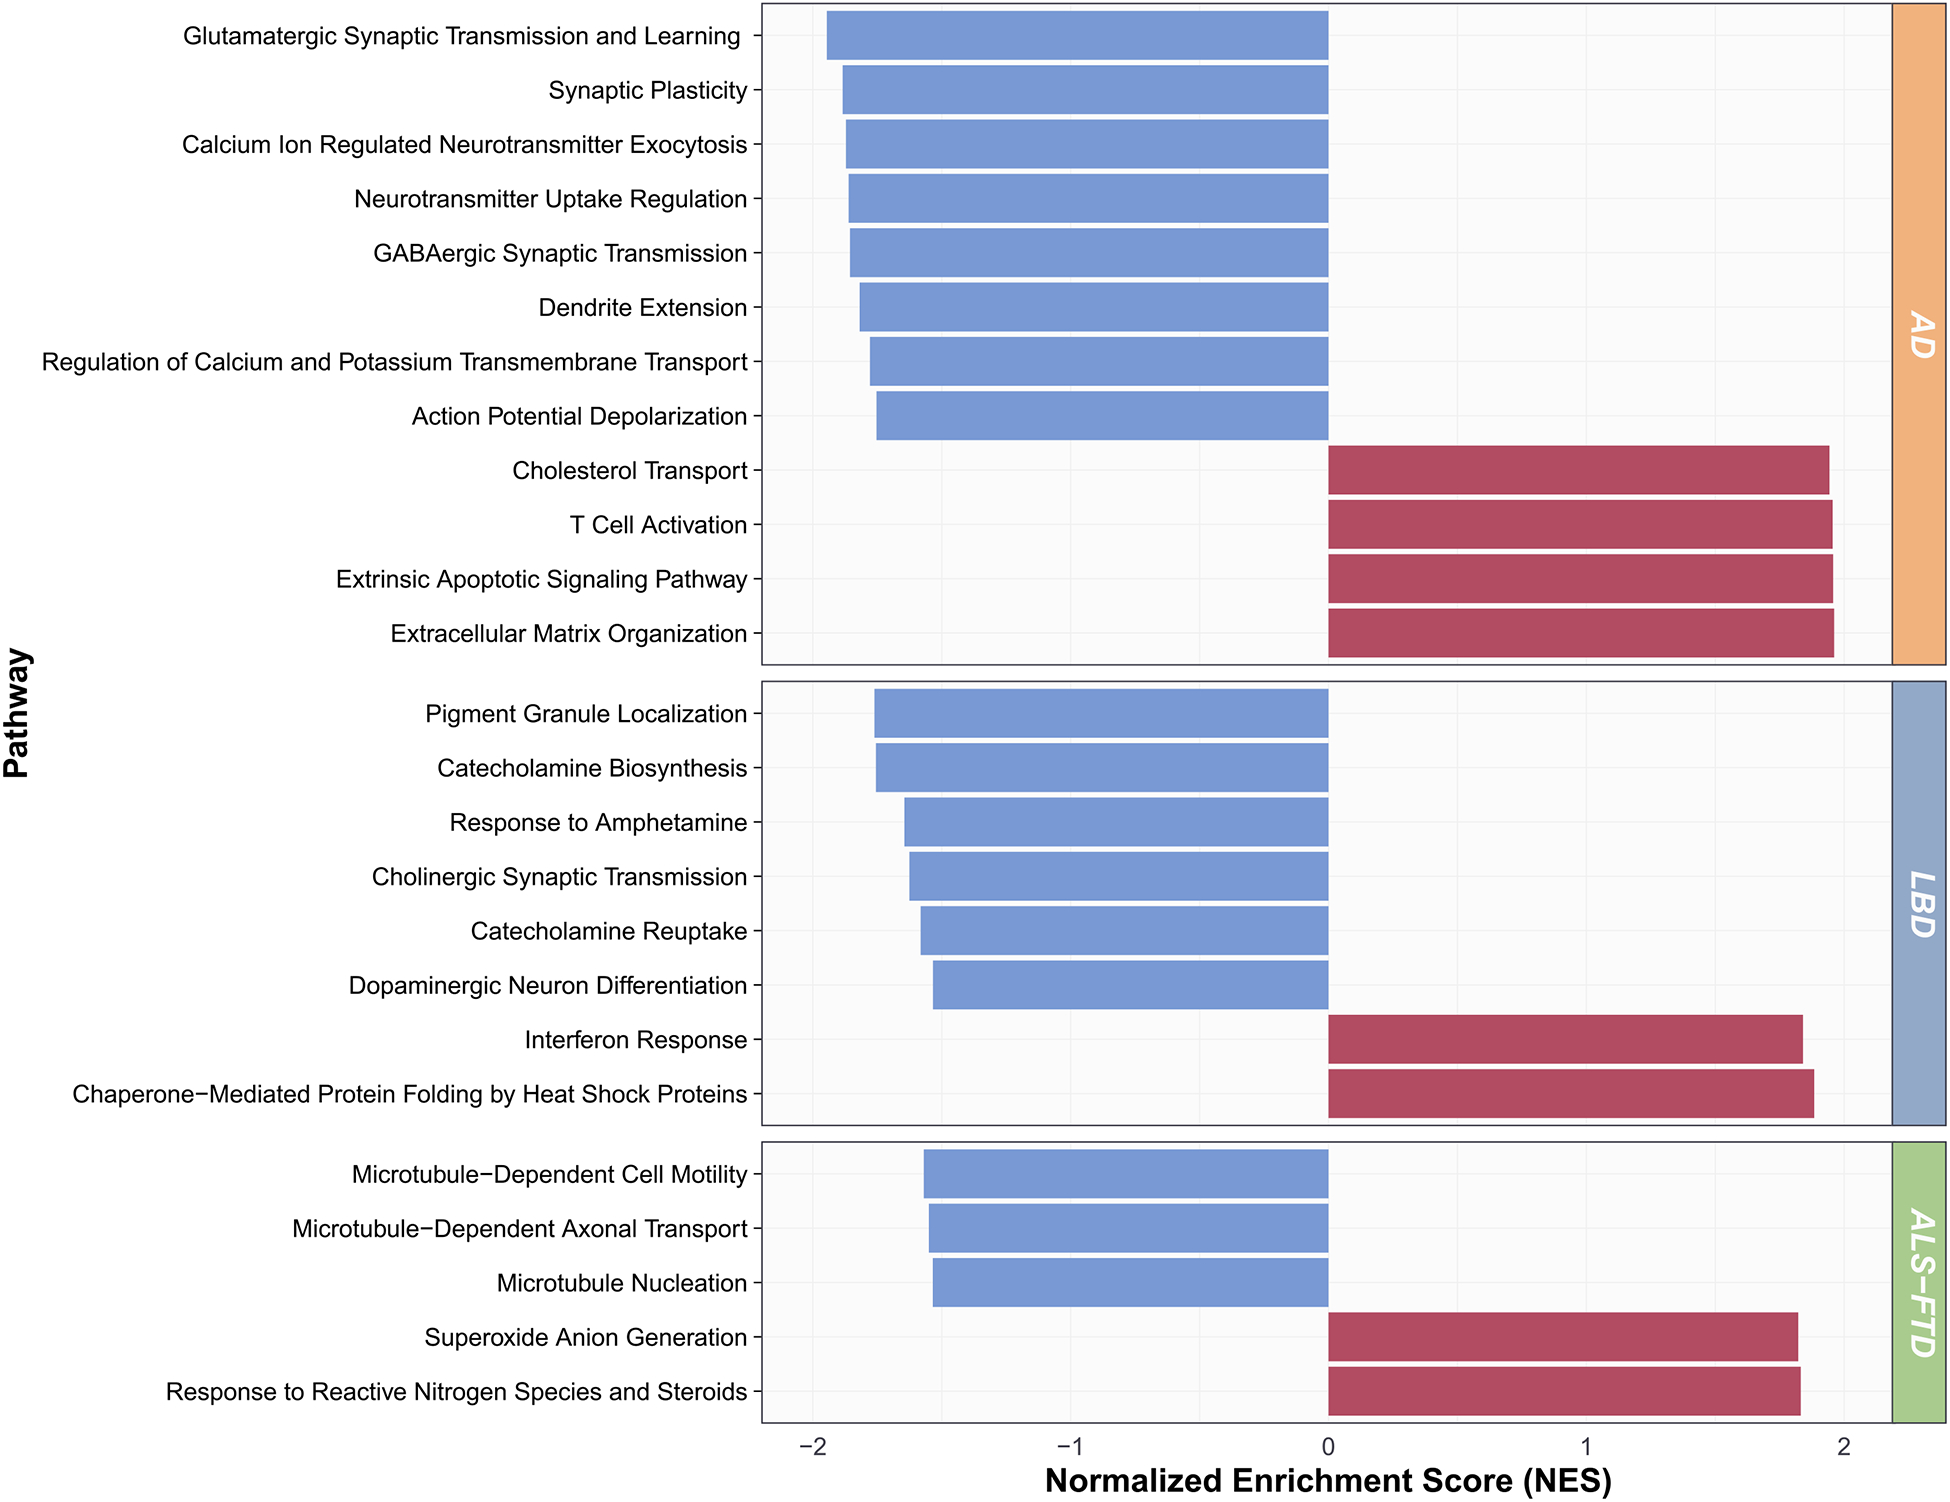
Gene set enrichment analysis (GSEA) normalized enrichment scores (NES) for representative disease-predominant pathways, averaged across the grouped GO: Biological Processes, are shown.
Official websites use .gov
A
.gov website belongs to an official
government organization in the United States.
Secure .gov websites use HTTPS
A lock (
) or https:// means you've safely
connected to the .gov website. Share sensitive
information only on official, secure websites.
Gene set enrichment analysis (GSEA) normalized enrichment scores (NES) for representative disease-predominant pathways, averaged across the grouped GO: Biological Processes, are shown.