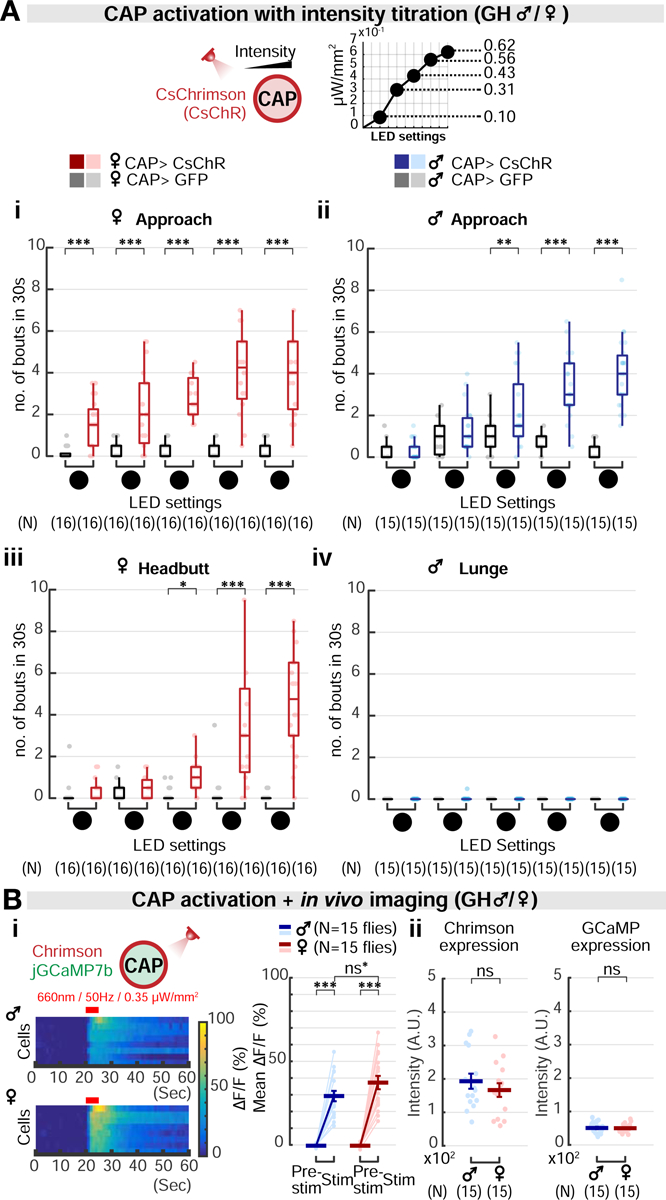
Figure 4. Aggression-promoting thresholds for CAP activation differ in males and females.

(A) Optogenetic activation of CAP neurons at five increasing intensities of photostimulation in females (i, iii) and males (ii, iv), with dependent variables of approach (i, ii) headbutt (iii) or lunge (iv). The intensities of the stimulation (❶-❺) correspond to 0.1, 0.31, 0.43, 0.56, 0.62 μW/mm2. Light circles: individual data.
(B) (i) GCaMP fluorescence changes (ΔF/F) in CAP neurons in response to photo-simulation of the same cells, in males versus females. Red bar: 5 seconds of 660nm photostimulation. Light circles: individual data. Dark lines: mean±SEM. ns*: non-significant after the Bonferroni correction. (ii) Expression level of Chrimson::tdTomato or GCaMP7b in male and female CAP neurons, measured by fluorescence intensity.
