
Figure 6. Functional connectivity between monomorphic and dimorphic circuit modules.
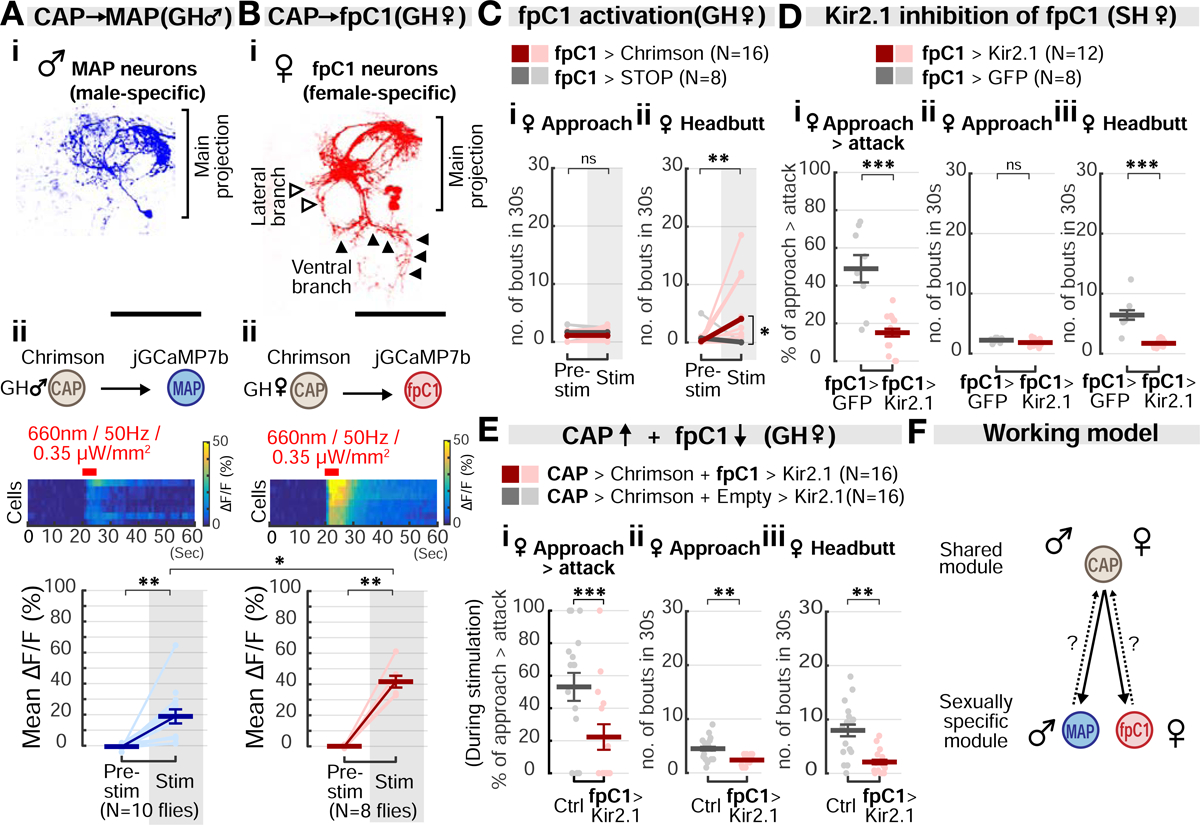
(A) Morphology of MAP neurons (i) and jGCaMP7b fluorescence changes (ii) in response to CAP stimulation in GH male flies. Light circles: individual data. Dark lines: mean±SEM. Fig. 6Ai is duplicated from Fig. 2Eiii for purposes of comparison between MAP and fpC1 neurons. Scale bar: 50μm. Mann-Whitney U test, corrected for multiple comparisons.
(B) Morphology of fpC1 neurons (i) and jGCaMP7b fluorescence changes (ii) in response to CAP stimulation in GH females. Light circles: individual data. Dark lines: mean±SEM. Scale bar: 50μm. Mann-Whitney U test, corrected for multiple comparisons.
(C) Optogenetic activation of fpC1 neurons promotes headbutting, but not approach, in GH females. Light and dark color lines: individual data and the means, respectively. See also Figures S4E and S5D.
(D) Inactivation of fpC1 neurons with Kir2.1 expression. Dark lines: mean±SEM. Light circles: individual data.
(E) Behavioral epistasis between the upstream CAP neurons and the downstream fpC1 neurons. Dark lines: mean±SEM. Light circles: individual data.
(F) Summary of circuit connectivity in males and females. Sexually monomorphic CAP neurons functionally connect with dimorphic MAP and fpC1 neurons in males and females, respectively. Dashed arrow: potential feedback from MAP/fpC1 onto CAP.