Figure 2.


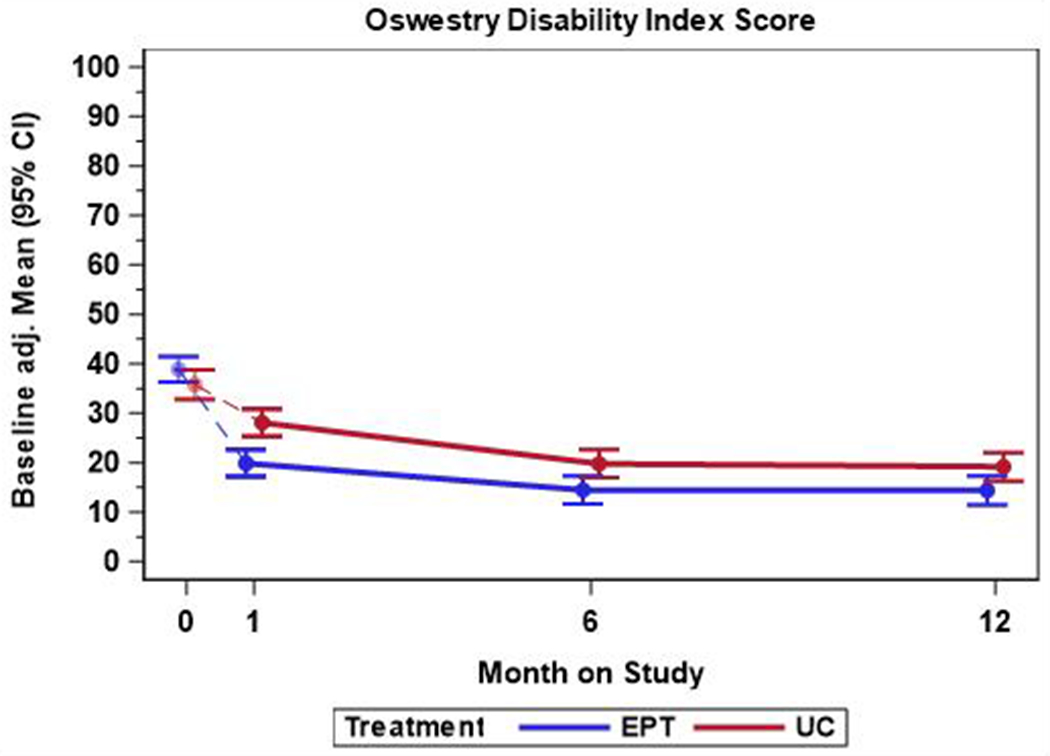
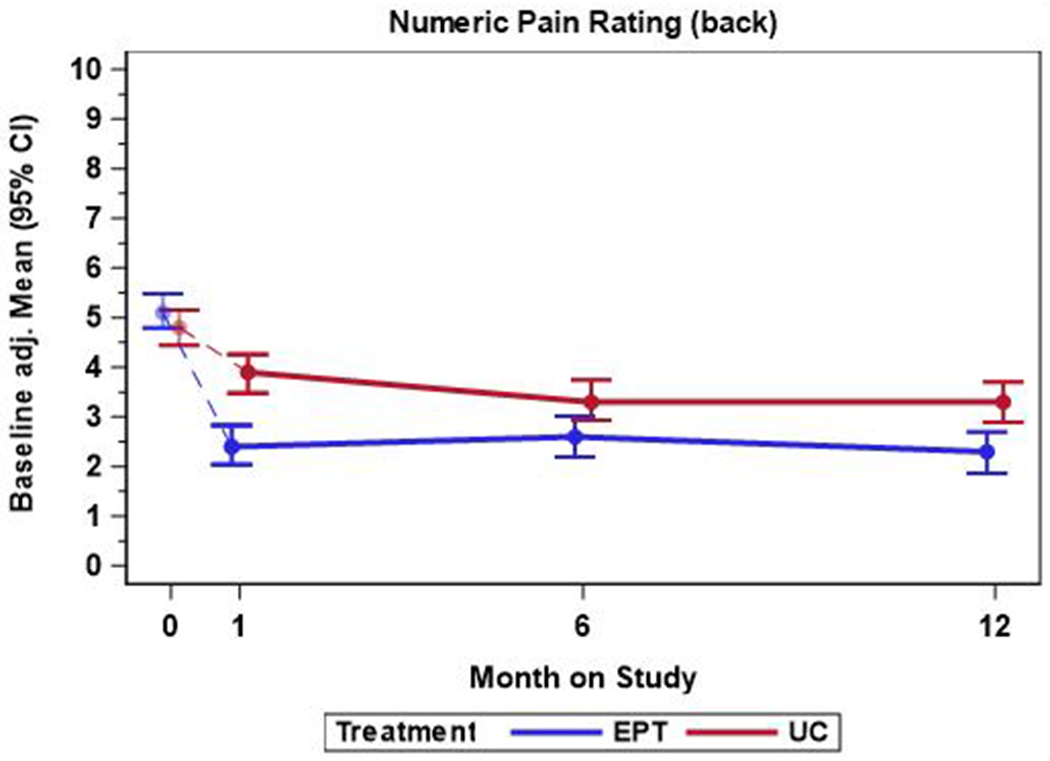
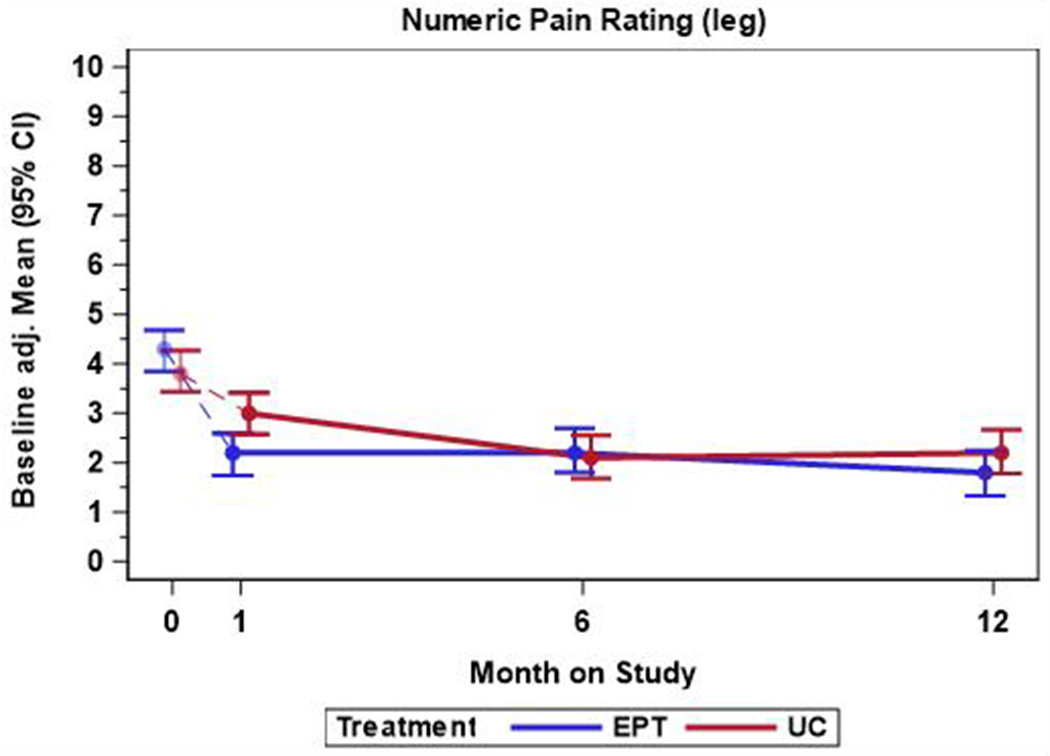
Time course of back pain–related disability, back pain intensity, and leg pain intensity, by treatment group. EPT = early physical therapy; UC = usual care. Top. The mean back pain–related disability scores were measured using the Oswestry Disability Index. Scores range from 0 to 100, with higher scores representing greater disability. Middle. Mean score for back pain intensity. Scores range from 0 to 10, with 0 indicating no pain and 10 indicating worst imaginable pain. Bottom. Mean score for leg pain intensity. Scores range from 0 to 10, with 0 indicating no pain and 10 indicating worst imaginable pain. Mean differences were calculated with linear mixed models. Error bars indicate 95% CIs. Raw means are provided at baseline.
