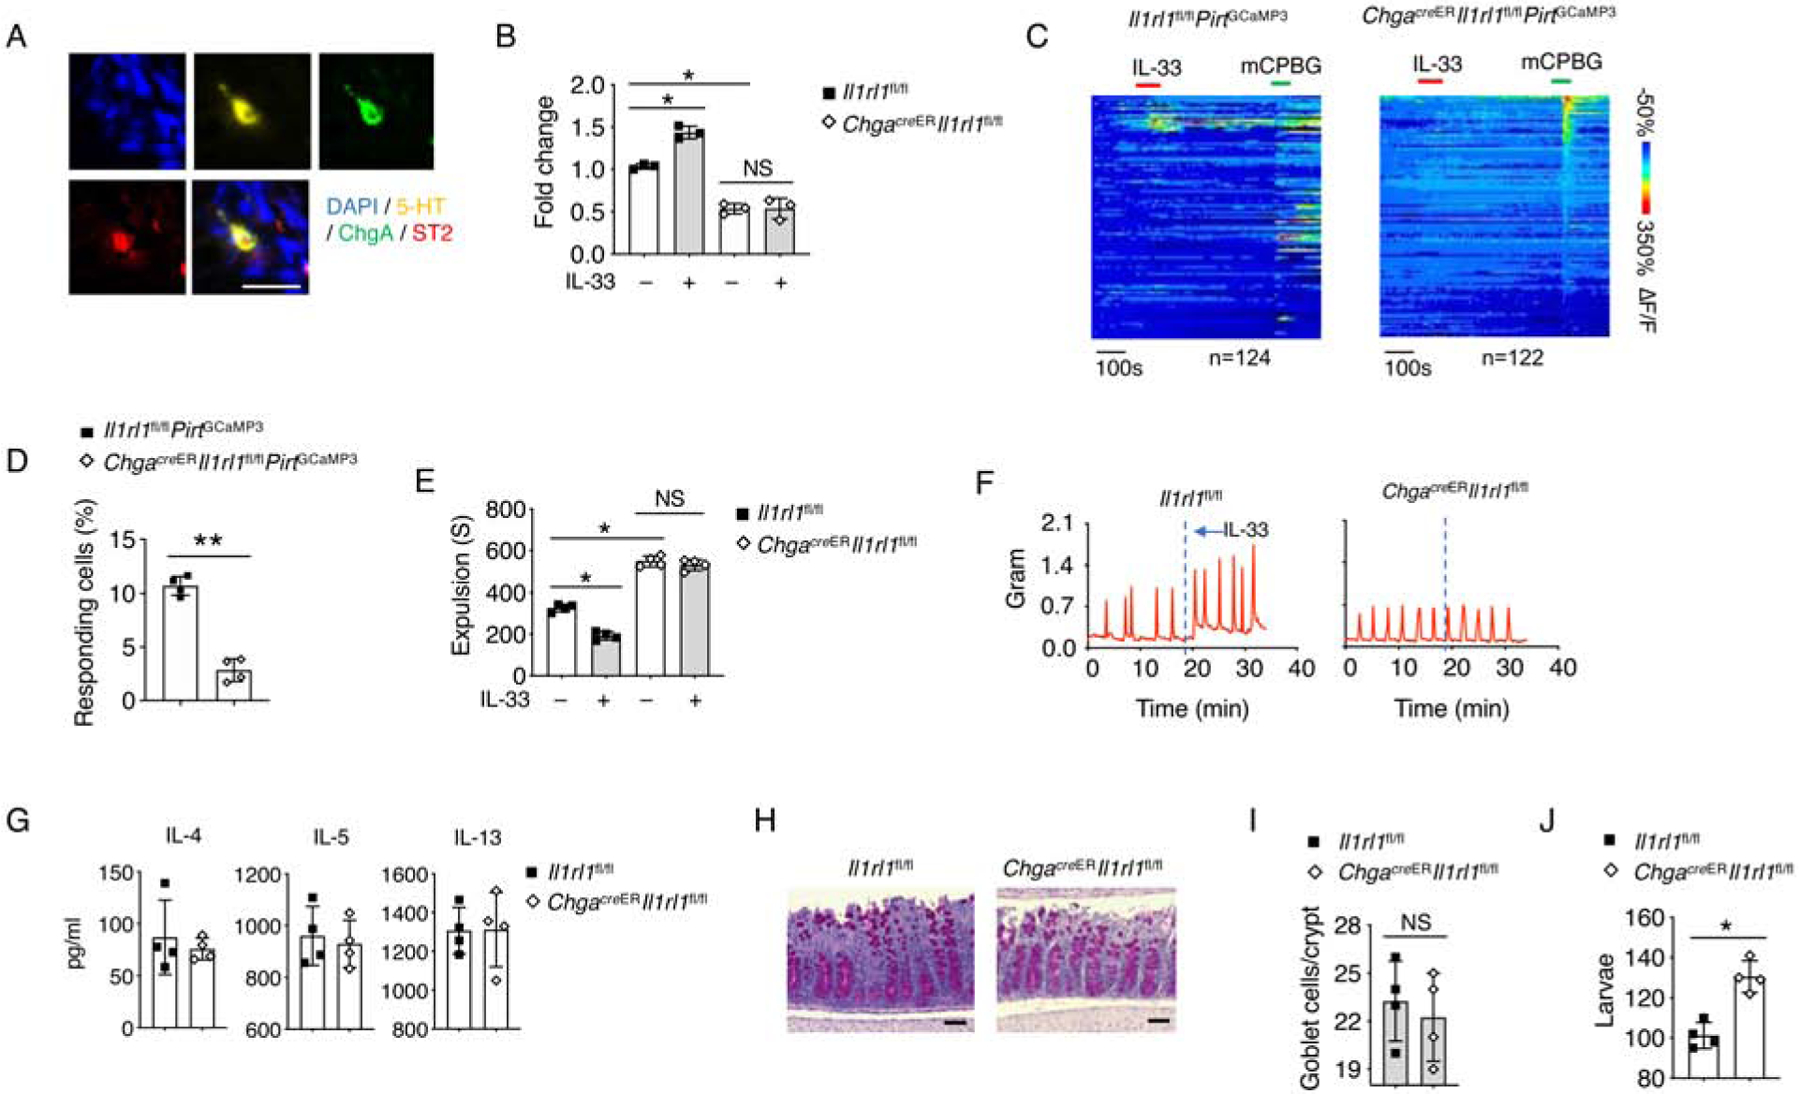
Figure 5. EC cell-derived ST2 responds to IL-33 for 5-HT release.

(A) Representative immunofluorescence staining for 5-HT, chromogranin A (ChgA), ST2 with DAPI in the intestinal tissues of WT mice. Scale bar, 10 μm.
(B) Il1rl1fl/fl and ChgacreERIl1rl1fl/fl mice were treated with PBS or IL-33, and waited for 10 minutes. Mice serum was collected, and relative 5-HT amounts were assessed by ELISA
(C) Time-resolved responses (ΔF/F, color scale) of neurons (one neuron per row) and (D) Quantification of IL-33 responding neurons in the myenteric plexus. mCPBG (5HT3R agonist) was used as a positive control.
(E) Il1rl1fl/fl and ChgacreERIl1rl1fl/fl mice were treated with PBS or IL-33, and waited for 10 minutes. Colonic transit time was measured by bead expulsion assay.
(F) Representative trace of IL-33-induced colon contraction in Il1rl1fl/fl and ChgacreERIl1rl1fl/fl mice.
(G-J) T. muris eggs were inoculated into Il1rl1fl/fl and ChgacreERIl1rl1fl/fl mice (pre-treated with tamoxifen) by oral gavage and the mice were sacrificed on day 14 for further testing.
(G) IL-4, IL-5 and IL-13 protein concentrations from mLN were assessed by ELISA.
(H) PAS staining and (I) Quantification of goblet cells per crypt in colonic tissues. Scale bar, 50 μm.
(J) Quantification of larvae in the colonic tissues.
Data are representative of two independent experiments (A-C, F-J) or are pooled from two independent experiments (D, E). NS, not significant; *p < 0.05; **p < 0.01 (Student’s t-test, error bars represent SD). Please also see Figure S5.
