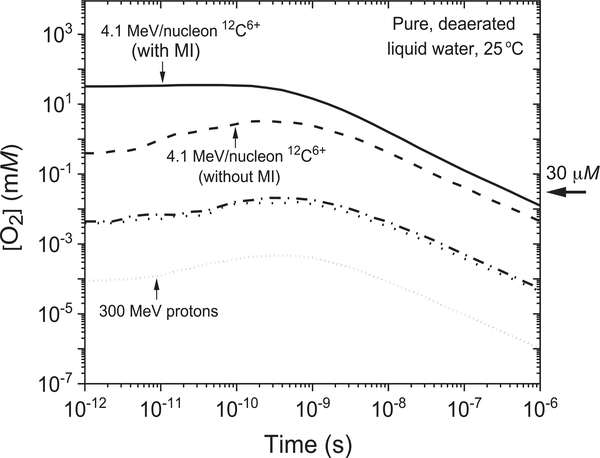
FIG. 3.
Time dependence of the corresponding track concentrations of O2 (in mM) (with and without multiple ionization of water molecules) calculated as explained in the text for the three incident carbon ions under consideration, using the G(O2) values reported in Fig. 1. As in Fig. 1, the [O2] values for the lower-LET 290 and 400 MeV/nucleon 12C6+ ions are represented by the dash-dot and dot-dot lines, respectively. The short-dot line corresponds to our calculated [O2] values for 300-MeV protons (which mimic the low-LET limiting case of 60Co γ or fast electron irradiation, LET ~ 0.3 keV/μm), shown in the figure for comparison. Typical O2 concentrations in normal human cells (~30 μM) are indicated by the arrow on the right side. MI = multiple ionization.

