Figure 2A & 2B.


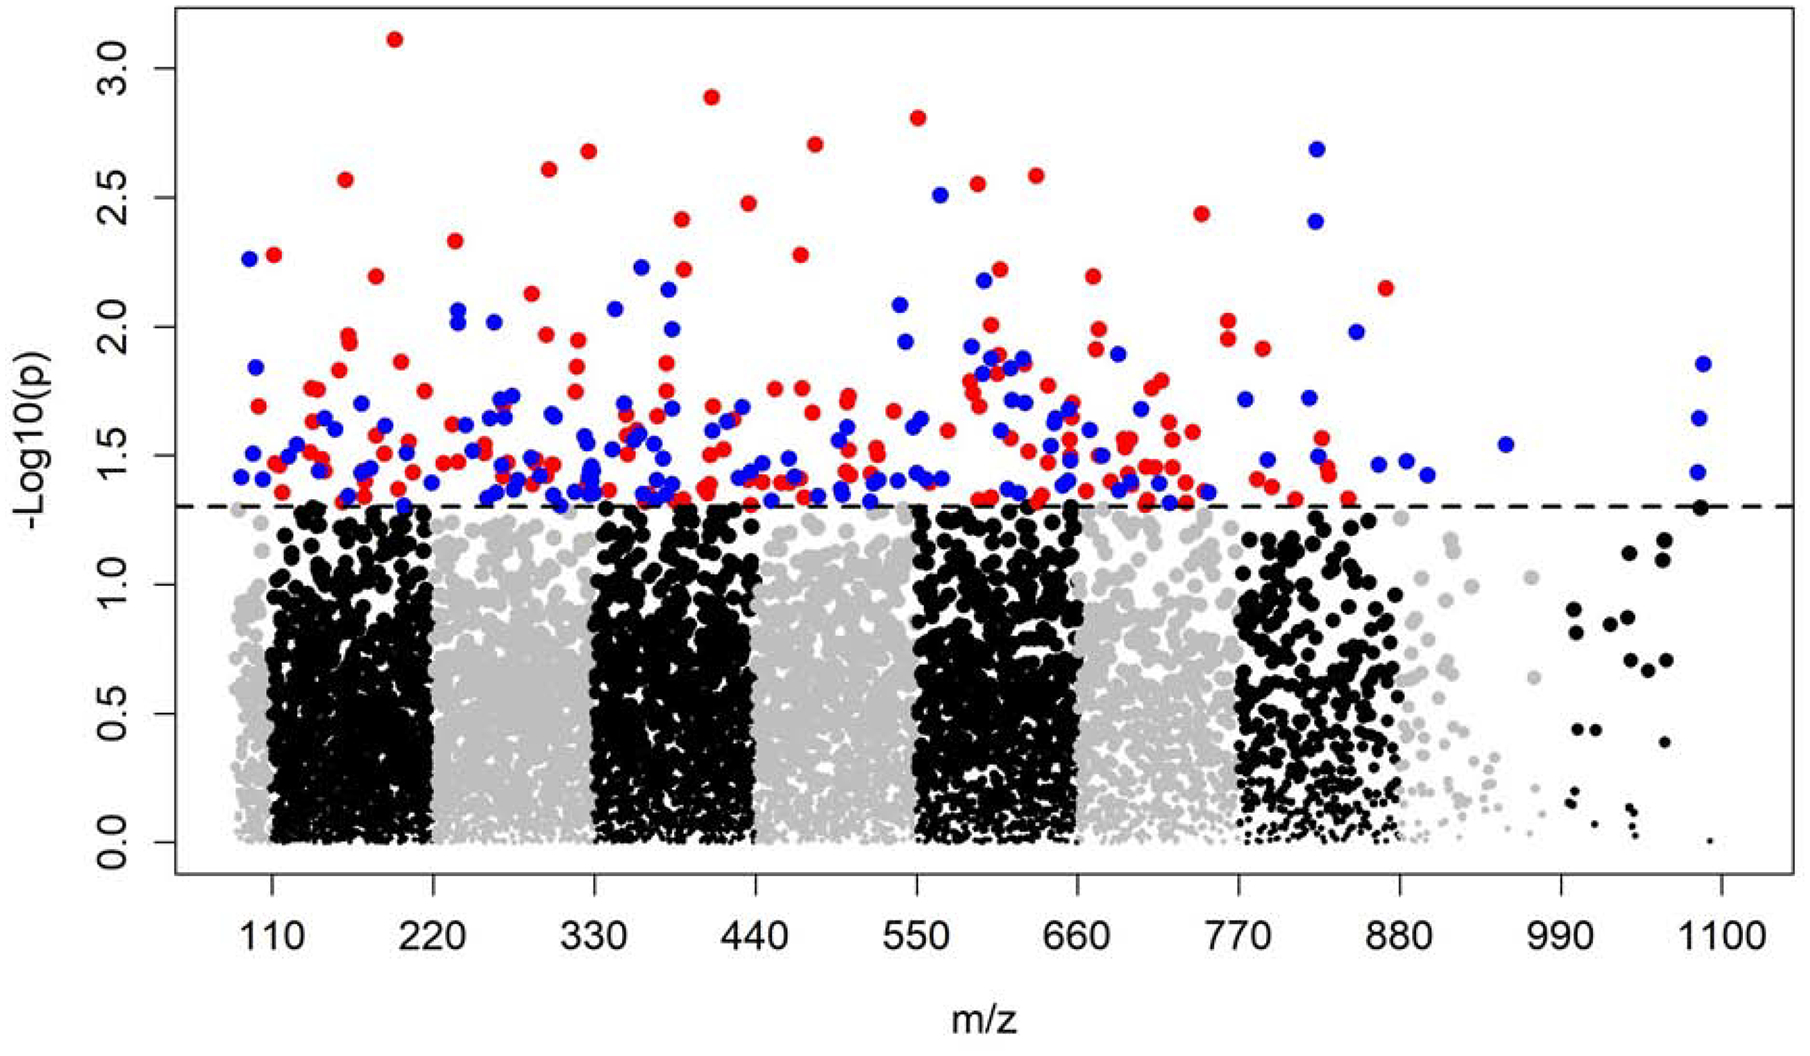
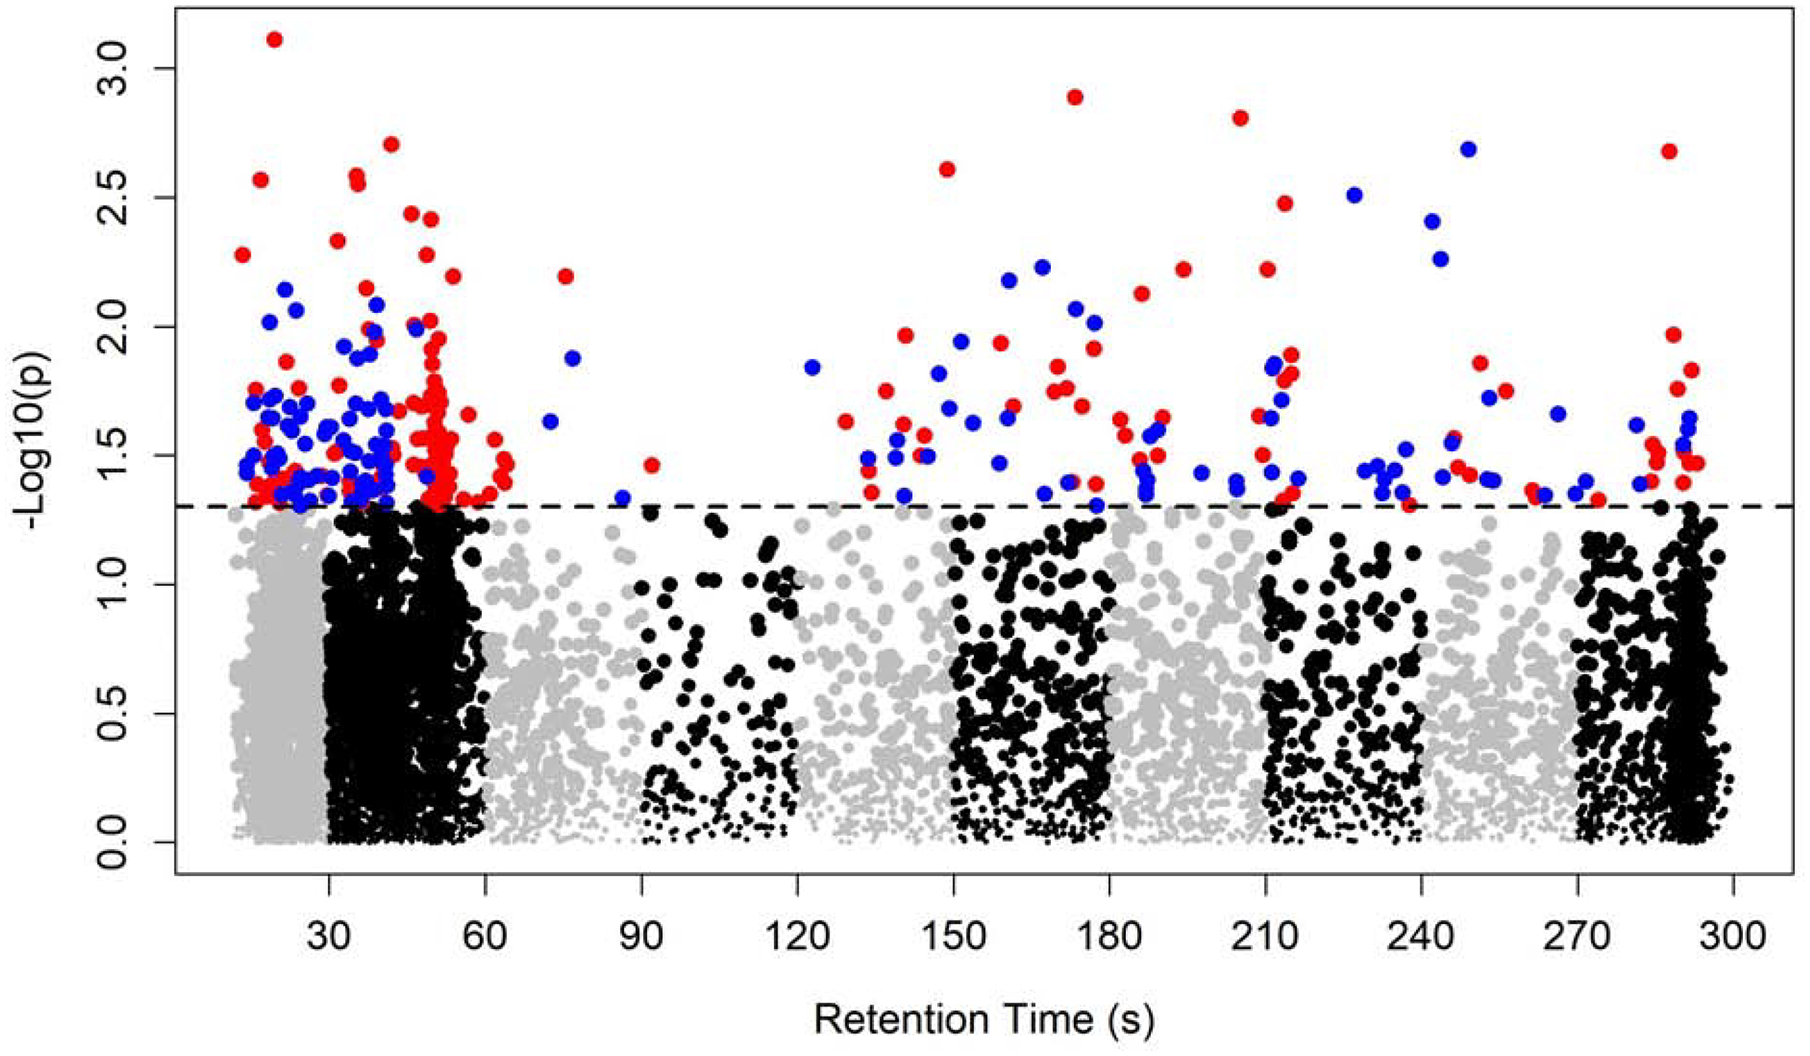
Manhattan plot of the metabolome-wide association study of CD. Total of 7,346 features. Dashed line indicates p=0.05. 157 features with p<0.05 and OR<1 colored in red; 132 features with p<0.05 and OR>1 colored in blue.


Manhattan plot of the metabolome-wide association study of CD. Total of 7,346 features. Dashed line indicates p=0.05. 157 features with p<0.05 and OR<1 colored in red; 132 features with p<0.05 and OR>1 colored in blue.