
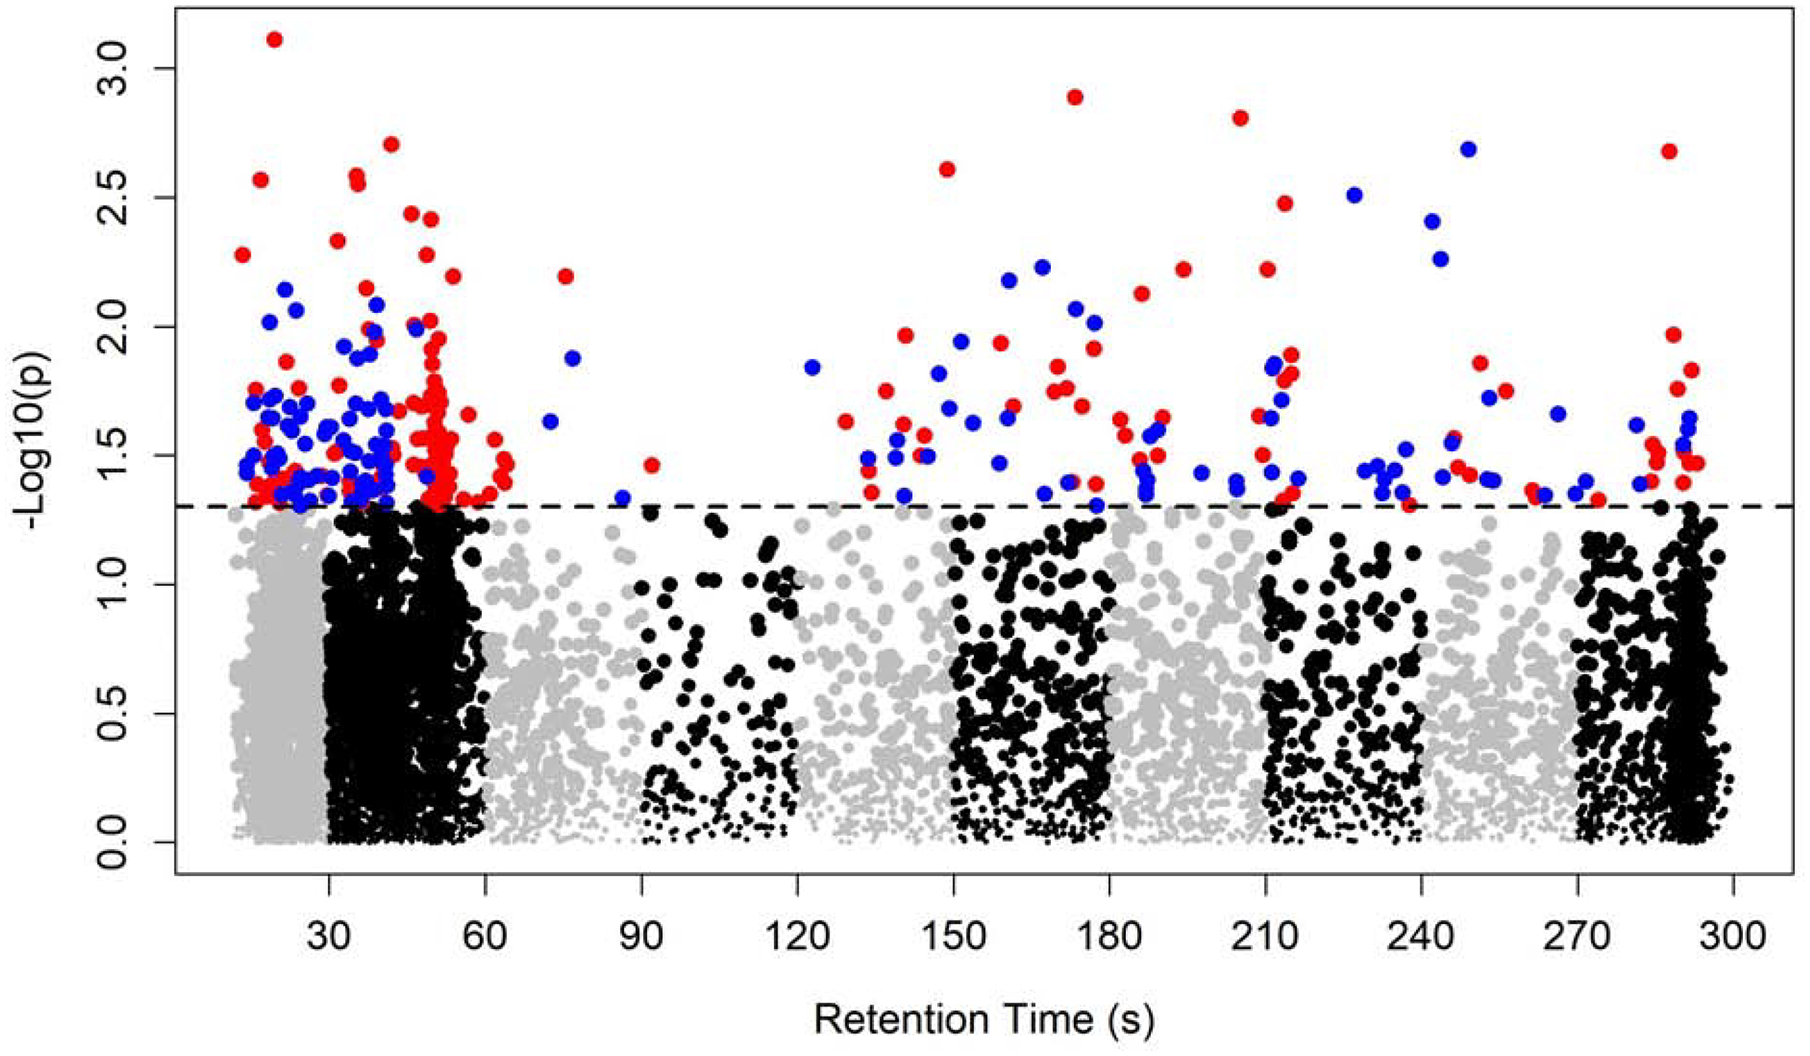
Figure 2A & 2B.
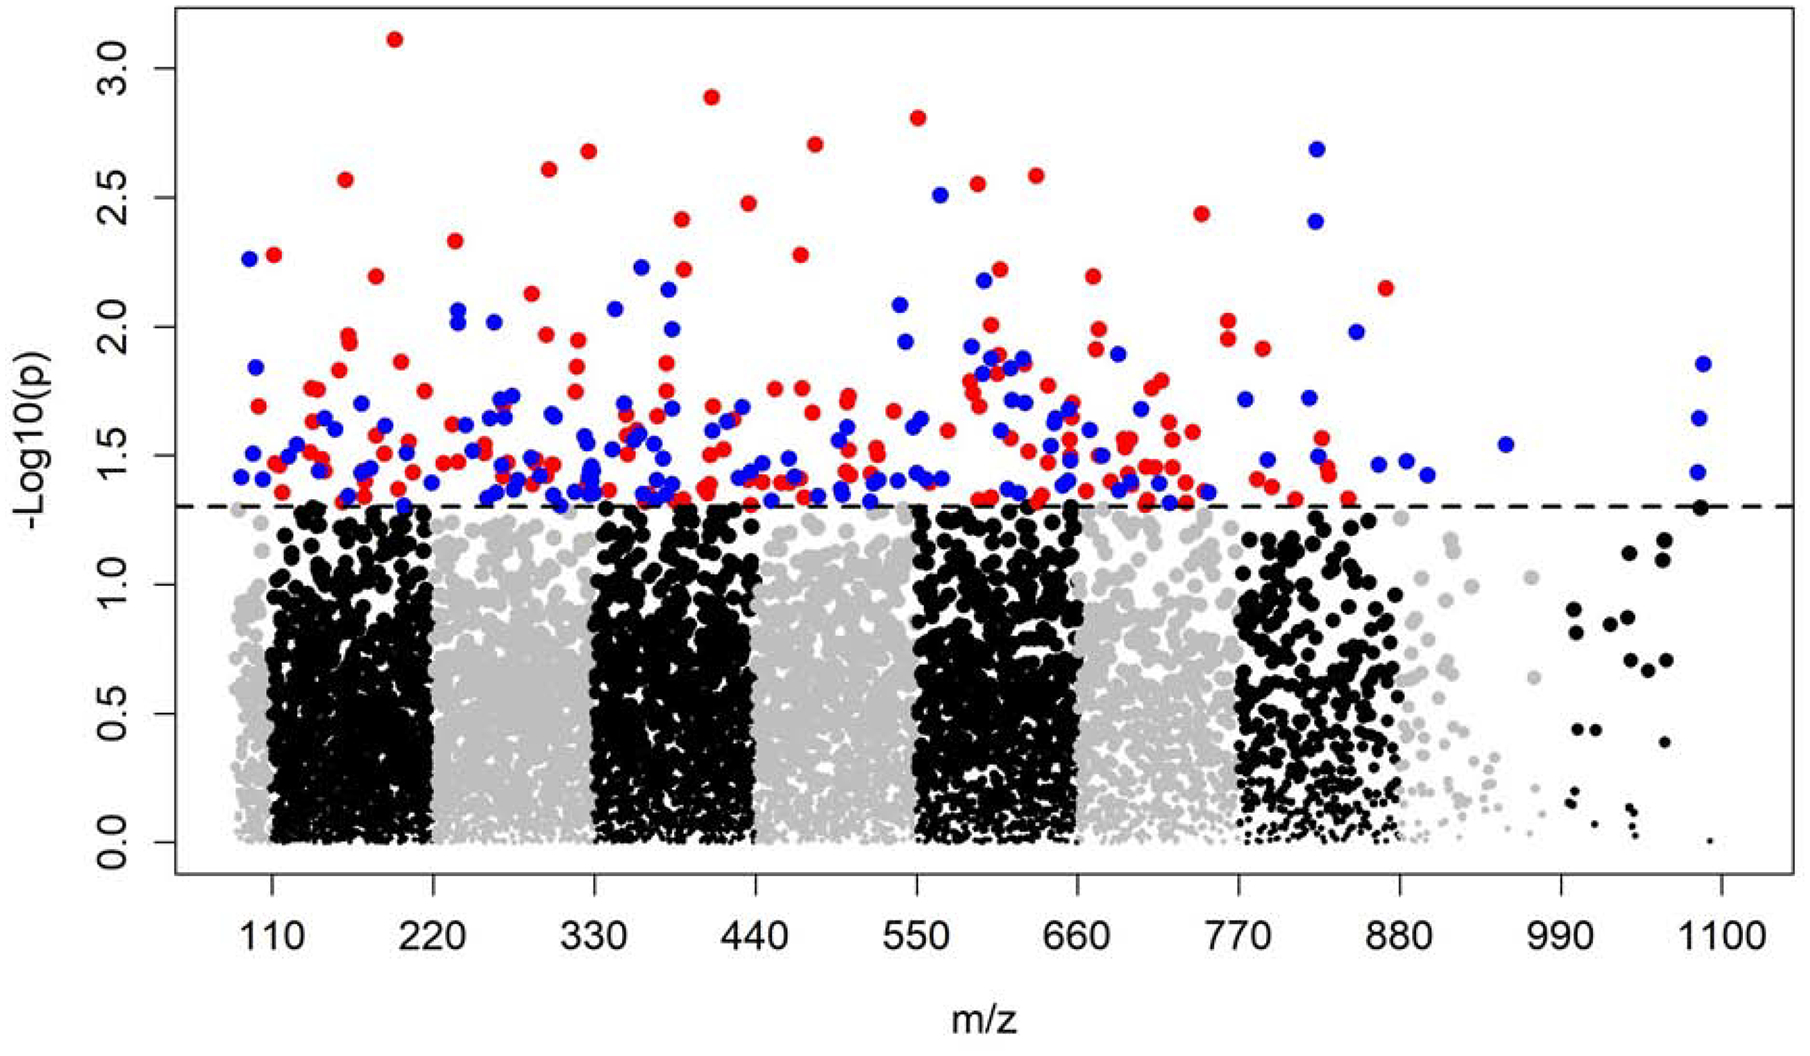
Manhattan plot of the metabolome-wide association study of CD. Total of 7,346 features. Dashed line indicates p=0.05. 157 features with p<0.05 and OR<1 colored in red; 132 features with p<0.05 and OR>1 colored in blue.
Official websites use .gov
A
.gov website belongs to an official
government organization in the United States.
Secure .gov websites use HTTPS
A lock (
) or https:// means you've safely
connected to the .gov website. Share sensitive
information only on official, secure websites.
Manhattan plot of the metabolome-wide association study of CD. Total of 7,346 features. Dashed line indicates p=0.05. 157 features with p<0.05 and OR<1 colored in red; 132 features with p<0.05 and OR>1 colored in blue.