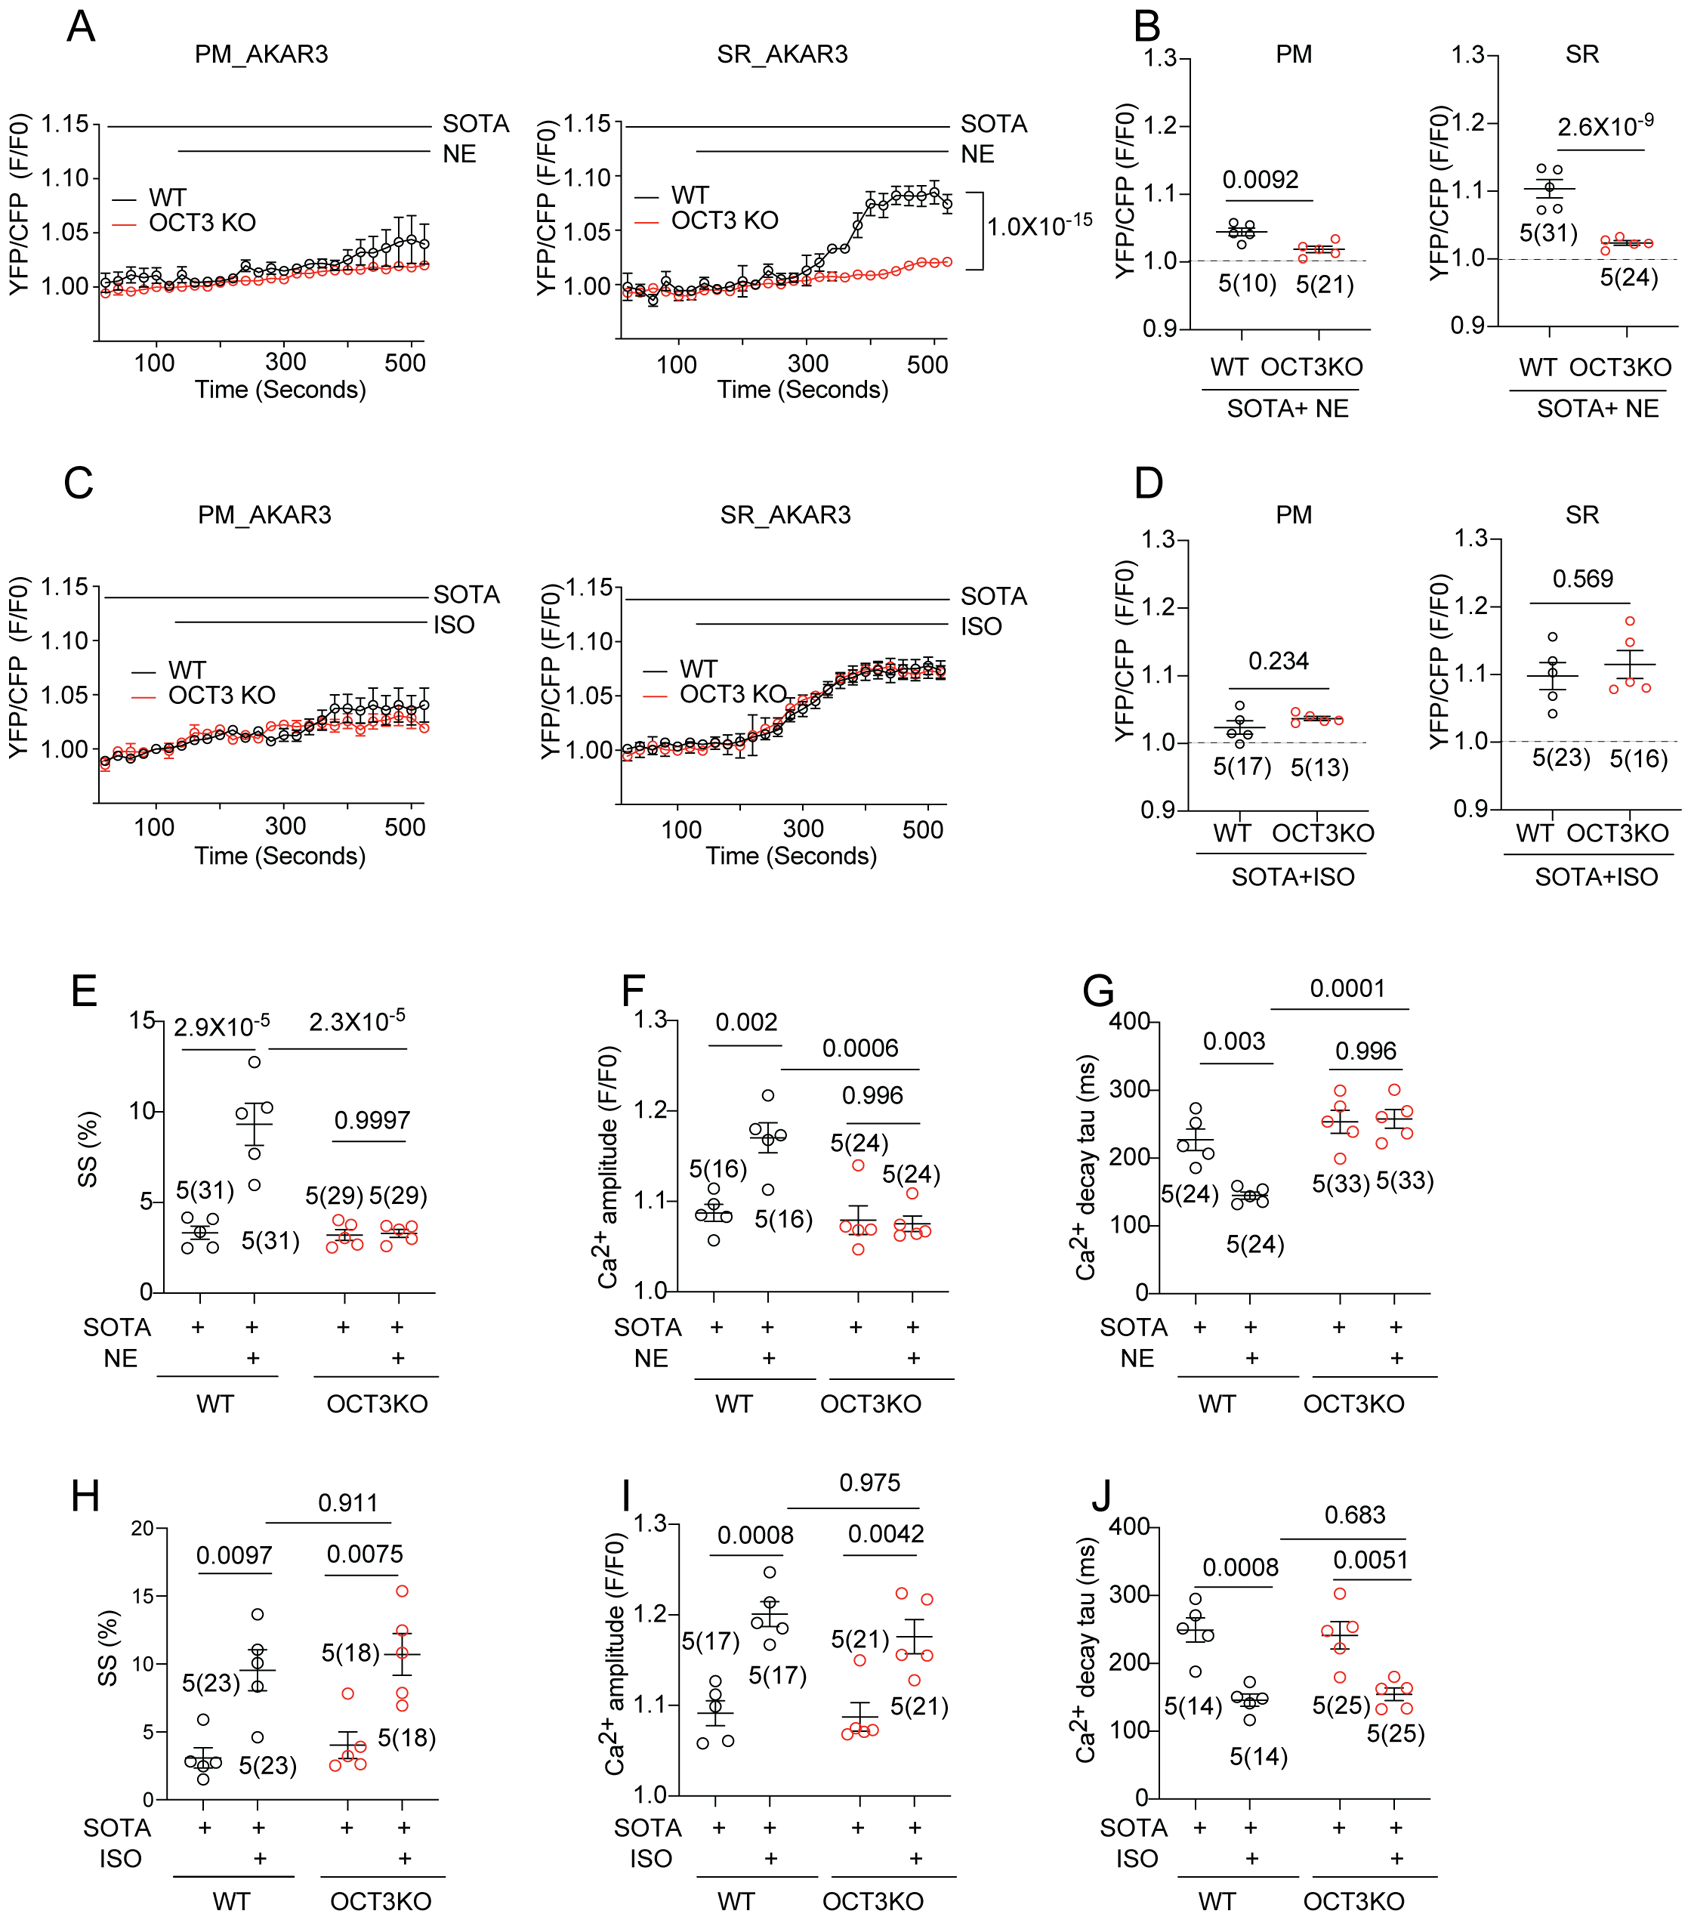
Figure 6. Activation of β1AR at the SR promotes myocyte calcium cycling and contractility.

(A, B) WT and OCT3KO AVMs were used to express PM-AKAR3 or SR-AKAR3 biosensors. FRET was analyzed as F/F0 of YFP/CFP ratio. Representative curves and maximal changes show subcellular PKA FRET responses to NE (100 nmol/L) stimulation in AVMs pretreated with sotalol (SOTA, 25 μmol/L). Animal numbers and cell numbers (in the parenthesis) are indicated. p values were obtained by two-way ANOVA analysis followed with Tukey’s multiple comparison test when compared to OCT3-KO. (C, D) WT and OCT3KO mouse AVMs were used to express PM-AKAR3 or SR-AKAR3 biosensors. Representative curves and maximal changes show subcellular PKA FRET responses to ISO (100 nmol/L) stimulation in AVMs pretreated with sotalol (SOTA, 25 μmol/L). Animal numbers and cell numbers (in the parenthesis) are indicated. p values were obtained by two-way ANOVA analysis followed with Tukey’s multiple comparison test when compared to OCT3-KO. (E-G) AVMs from WT and OCT3 hearts were stimulated with NE (100 nmol/L) in the presence of SOTA (25 μmol/L) pretreatment. Data show maximal changes in sarcomere shortening (SS), Ca2+ transient amplitude, and rate of Ca2+ decay (Tau) as mean ± S.E.M. Animal numbers and cell numbers (in the parenthesis) are indicated in figures. p values were obtained by two-way ANOVA analysis with Tukey’s multiple comparison test. (H-J) AVMs from WT and OCT3 hearts were stimulated with ISO (100 nmol/L) in the presence of SOTA (25 μmol/L) pretreatment. Data show maximal changes in SS, Ca2+ transient amplitude, and Tau as mean ± S.E.M. Animal numbers and cell numbers (in the parenthesis) are indicated. p values were obtained by two-way ANOVA analysis with Tukey’s multiple comparison test.
