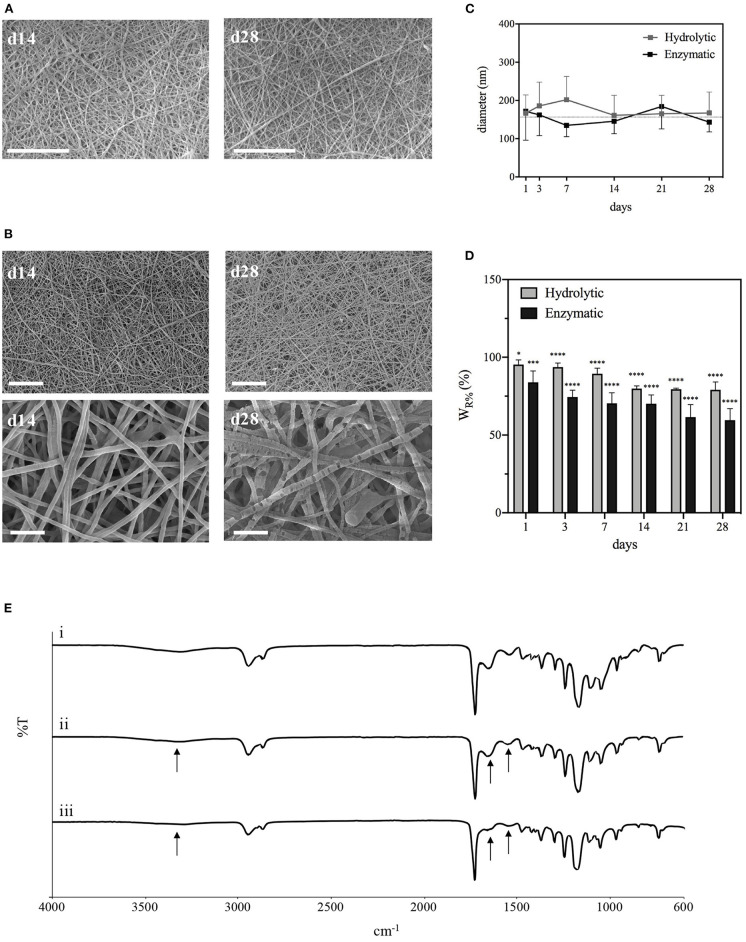
Figure 6.
Characterizations of PCL-Gel membranes degraded in PBS or collagenase solutions at 37°C. (A) SEM images of PCL-Gel after 14 or 28 days of hydrolytic degradation at 5kx magnification; (B) FESEM images of PCL-Gel after 14 or 28 days of enzymatic degradation at different magnifications (left 5kx; right 50kx). Scale bars equal to 10 μm for 5kx and 1 μm for 50kx. (C) Variations in nanofibers diameter and (D) membranes weight loss; (E) comparison of FTIR spectra of PCL-Gel membranes at (i) day 0, and day 28 of (ii) hydrolytic and (iii) enzymatic degradation. Data are presented as mean ± standard deviation (n > 3). Asterisks denote statistically significant differences compared to t = 0 (*p < 0.01, ***p < 0.0001, and ****p < 0.00001), as determined by analysis of variance followed by a post-hoc Bonferroni test.

