
Figure 4. Late injury and cell death is increased in EtOH-exposed fetal brains.
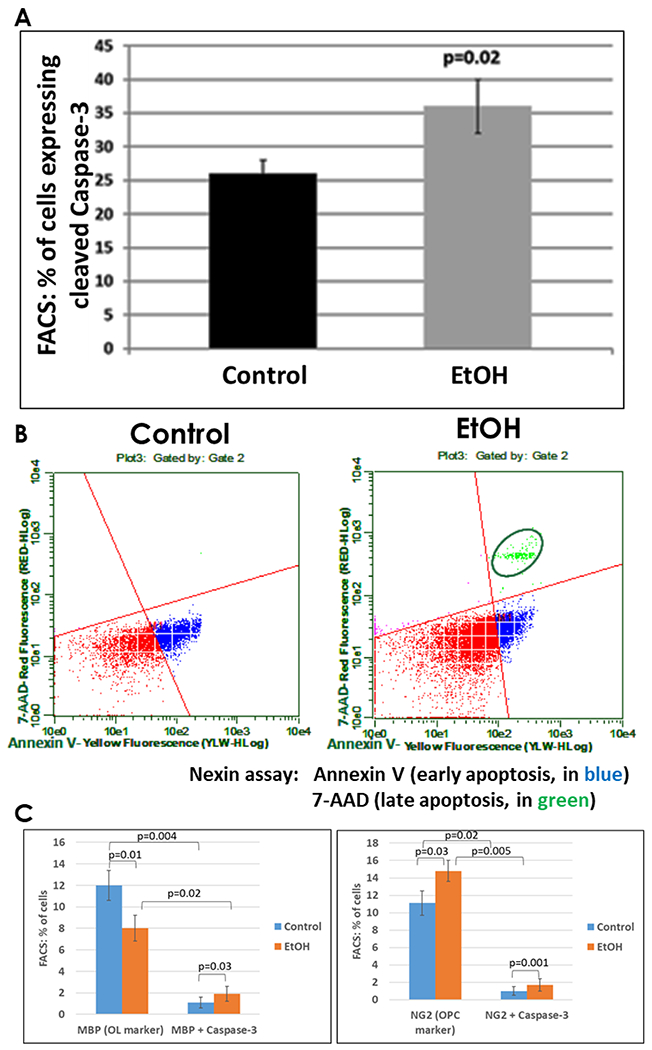
A, the effect of EtOH exposure on relative expression of cleaved caspase-3 was determined by FACS analysis in 6 EtOH-exposed cases and 6 controls in the late second trimester. Relative proportions of all cells (mixed cell types) expressing activated caspase-3 in the fetal brains used for Figures 1 and 3 (n = 6 per group, GA=18.6-21.3 weeks for the Control group vs. GA=19.3-21.4 weeks for EtOH-exposed group) is shown in bar graph. Error bars are for standard deviation. B, measures of early apoptosis and cell death in the same samples used in A. Representative dot-plots of the flow cytometry to measure membrane changes associated with early apoptosis, using annexin V-PE, and 7-AAD to identify dead cells. Three populations are identified with the Guava nexin reagent and analyzed with the Guava nexin software: the lower left quadrant (red) represents the live cells, i.e., 7-AAD and annexin-V-PE negative; the lower right quadrant (blue) represents early apoptotic cells with signs of injury or enhanced vulnerability, i.e., 7-AAD negative and annexin-V-PE positive. The upper right quadrant (green) represents dead or almost dead cells, i.e., 7-AAD and annexin-V-PE positive. C, co-expression of cleaved caspase-3 and the OL marker MBP (left panel), or the OPC marker NG2 (right panel), determined by FACS analysis in the samples used for 4A.