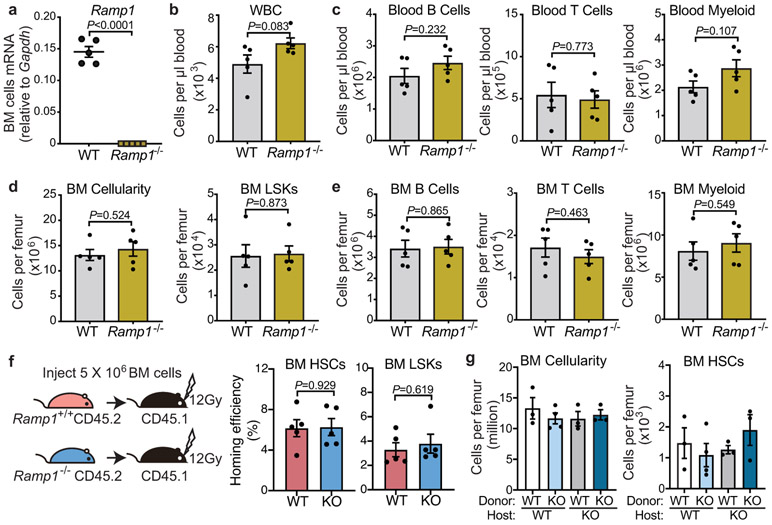
Extended Data Fig. 6. Ramp1-deficient mice exhibit no haematopoietic defect at steady state.
a, Ramp1 mRNA expression levels determined by quantitative PCR in total bone marrow cells derived from Ramp1+/+ or Ramp1−/− mice. n=5 biological sample. b, c, White blood cell counts, and the absolute numbers of B cells (B220+), T cell (CD3e+) and myeloid cells (Mac-1+) per mL of peripheral blood from Ramp1+/+ or Ramp1−/− mice at steady state. n=5 mice per group. d, e, Bone marrow cellularity, and the absolute numbers of LSK (Lin− Sca-1+ c-Kit +) cells, B cells (B220+), T cell (CD3e+) and myeloid cells (Mac-1+) per femur from Ramp1+/+ or Ramp1−/− mice at steady state. n=5 mice per group. f, Experimental design to determine the homing efficiency of HSCs (Lin− Sca-1+ c-Kit+ CD150+ CD48−) and LSK cells from Ramp1+/+ and Ramp1−/− mice (CD45.2) to the bone marrow of lethally irradiated recipients (CD45.1) (left panel). Percentage of donor CD45.2+ HSCs and LSK cells detected in the recipient bone marrow (right panel). n=5 mice per group. g, BM cellularity and the absolute number of HSCs in the BM. n=3, 4, 3, 3 mice, respectively. Error bars represent s.e.m. Two-tailed unpaired Student’s t test (a-f) or one-way ANOVA (g).

