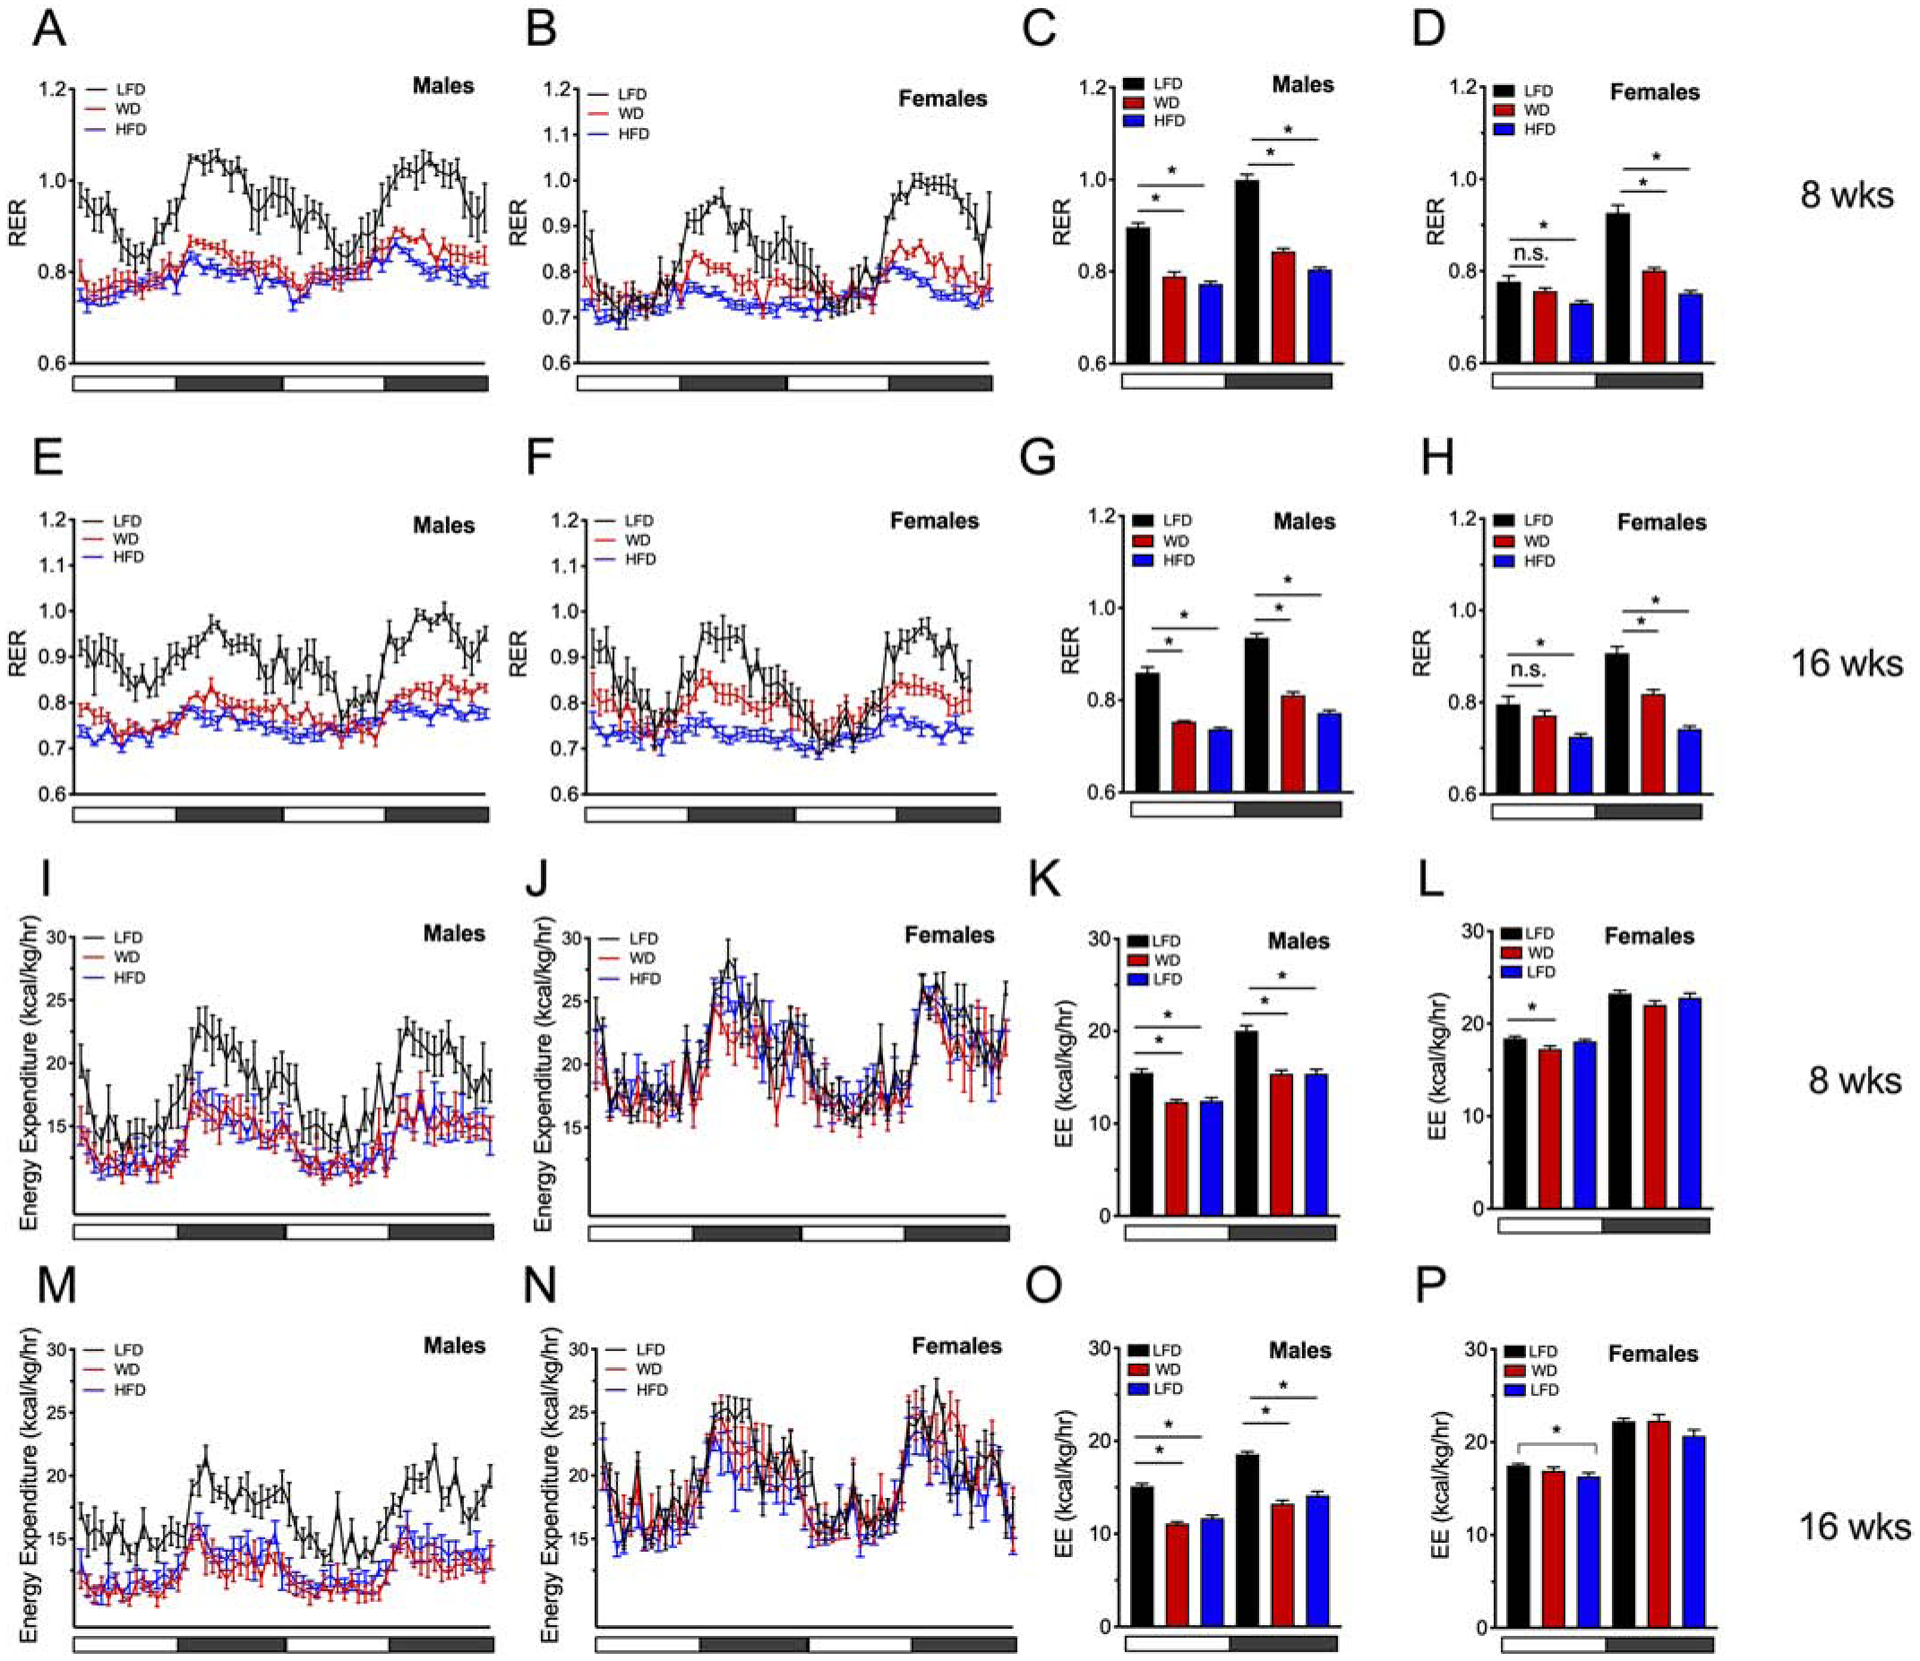
Figure 3: High fat dietary intervention results in a reduction in RER in both male and female mice.

Male and female C57BL6/J mice were placed on a dietary intervention starting at 4 weeks of age and were singly housed in a PhenoMaster LabMaster indirect calorimeter. (A) Calculated RERs in male mice at 8 weeks of dietary intervention over a 48-hour period; (B) Calculated RERs in female mice at 8 weeks of dietary intervention over a 48-hour period. (C) Average RER values during the light or dark cycle in male mice; (D) Average RER values during the light or dark cycle in female mice. (E) RER values in male mice at 16 weeks of dietary intervention over a 48-hour period; (F) RER values in female mice at 16 weeks of dietary intervention over a 48-hour period; (G) Average RER values during the light or dark cycle in male mice; (H) Average RER values during the light or dark cycle in female mice at 16 weeks of diet; Energy expenditure was calculated in three 24 hour cycles at 8 or 16 weeks of dietary intervention (I) Energy expenditure in male mice at 8 weeks of diet (48 hour cycle shown); (J) Energy expenditure in female mice at 8 weeks of diet (48 hour cycle shown); (K) Average EE values during the light or dark cycle in male mice at 8 weeks of diet; (L) Average EE values during the light or dark cycle in female mice at 8 weeks of diet; (J) Energy expenditure in female mice at 16 weeks of diet (48 hour cycle shown); (K) Average EE values during the light or dark cycle in male mice at 16 weeks of diet; (L) Average EE values during the light or dark cycle in female mice at 16 weeks of diet; Horizontal white x-axes bars denote light cycles (0700 – 1900) and dark gray horizontal bars denote dark cycles (1900 – 0700). Results are displayed as means ± SEM; n=10 per treatment group for RER studies; n=5 per treatment group for EE studies; Means were compared by one-way ANOVA followed by Tukey’s posttest; *, p<0.05 for indicated comparisons.
