Figure 10:

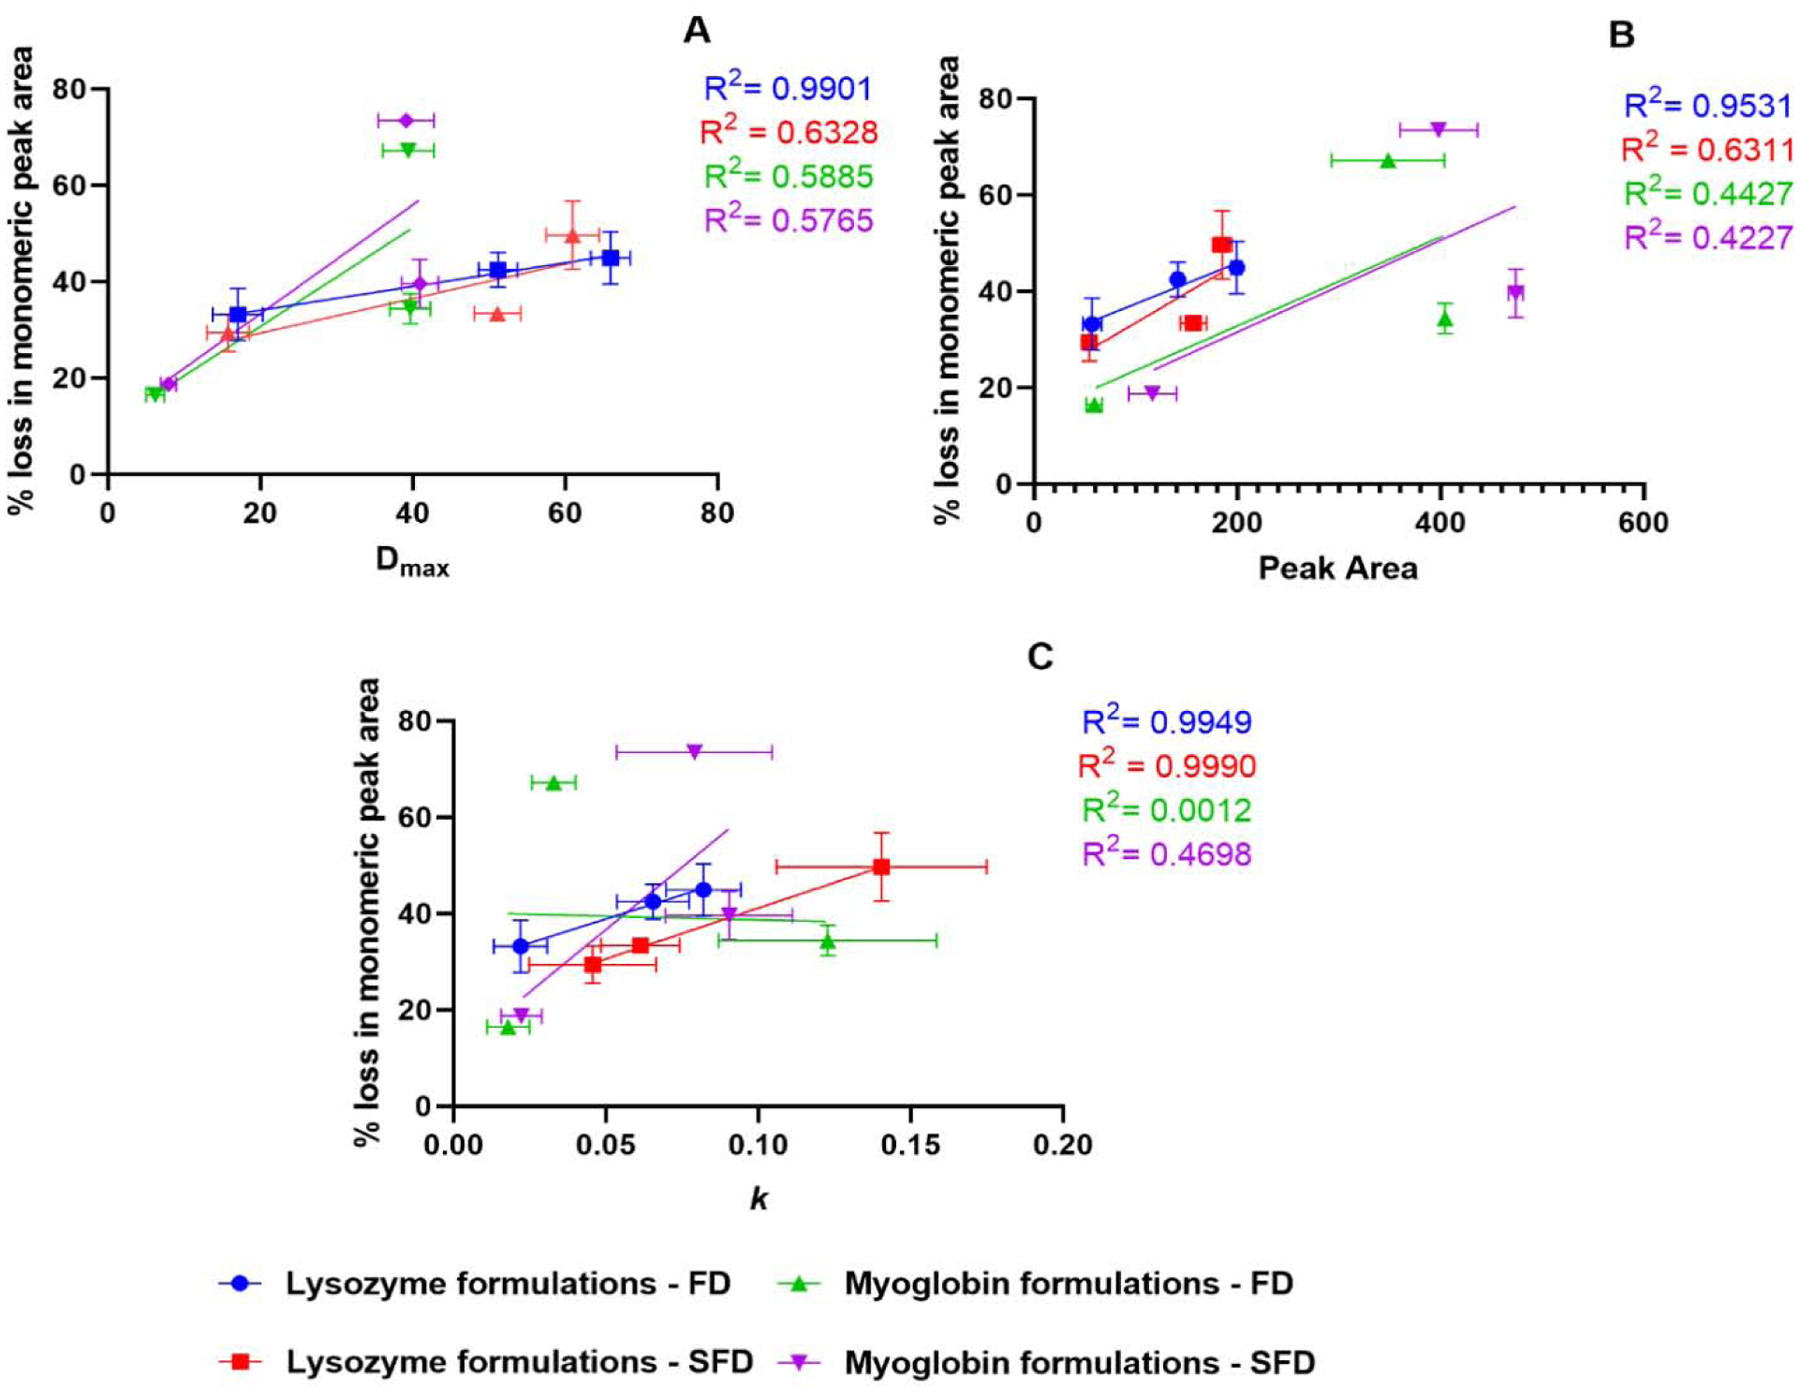
Correlation of 90-day physical stability results with Dmax(A), peak area of deuterated samples (B) and deuterium exchange rate k (C). (n = 3, mean ± SD; error bars not shown when less than the height of the symbol.)

Correlation of 90-day physical stability results with Dmax(A), peak area of deuterated samples (B) and deuterium exchange rate k (C). (n = 3, mean ± SD; error bars not shown when less than the height of the symbol.)