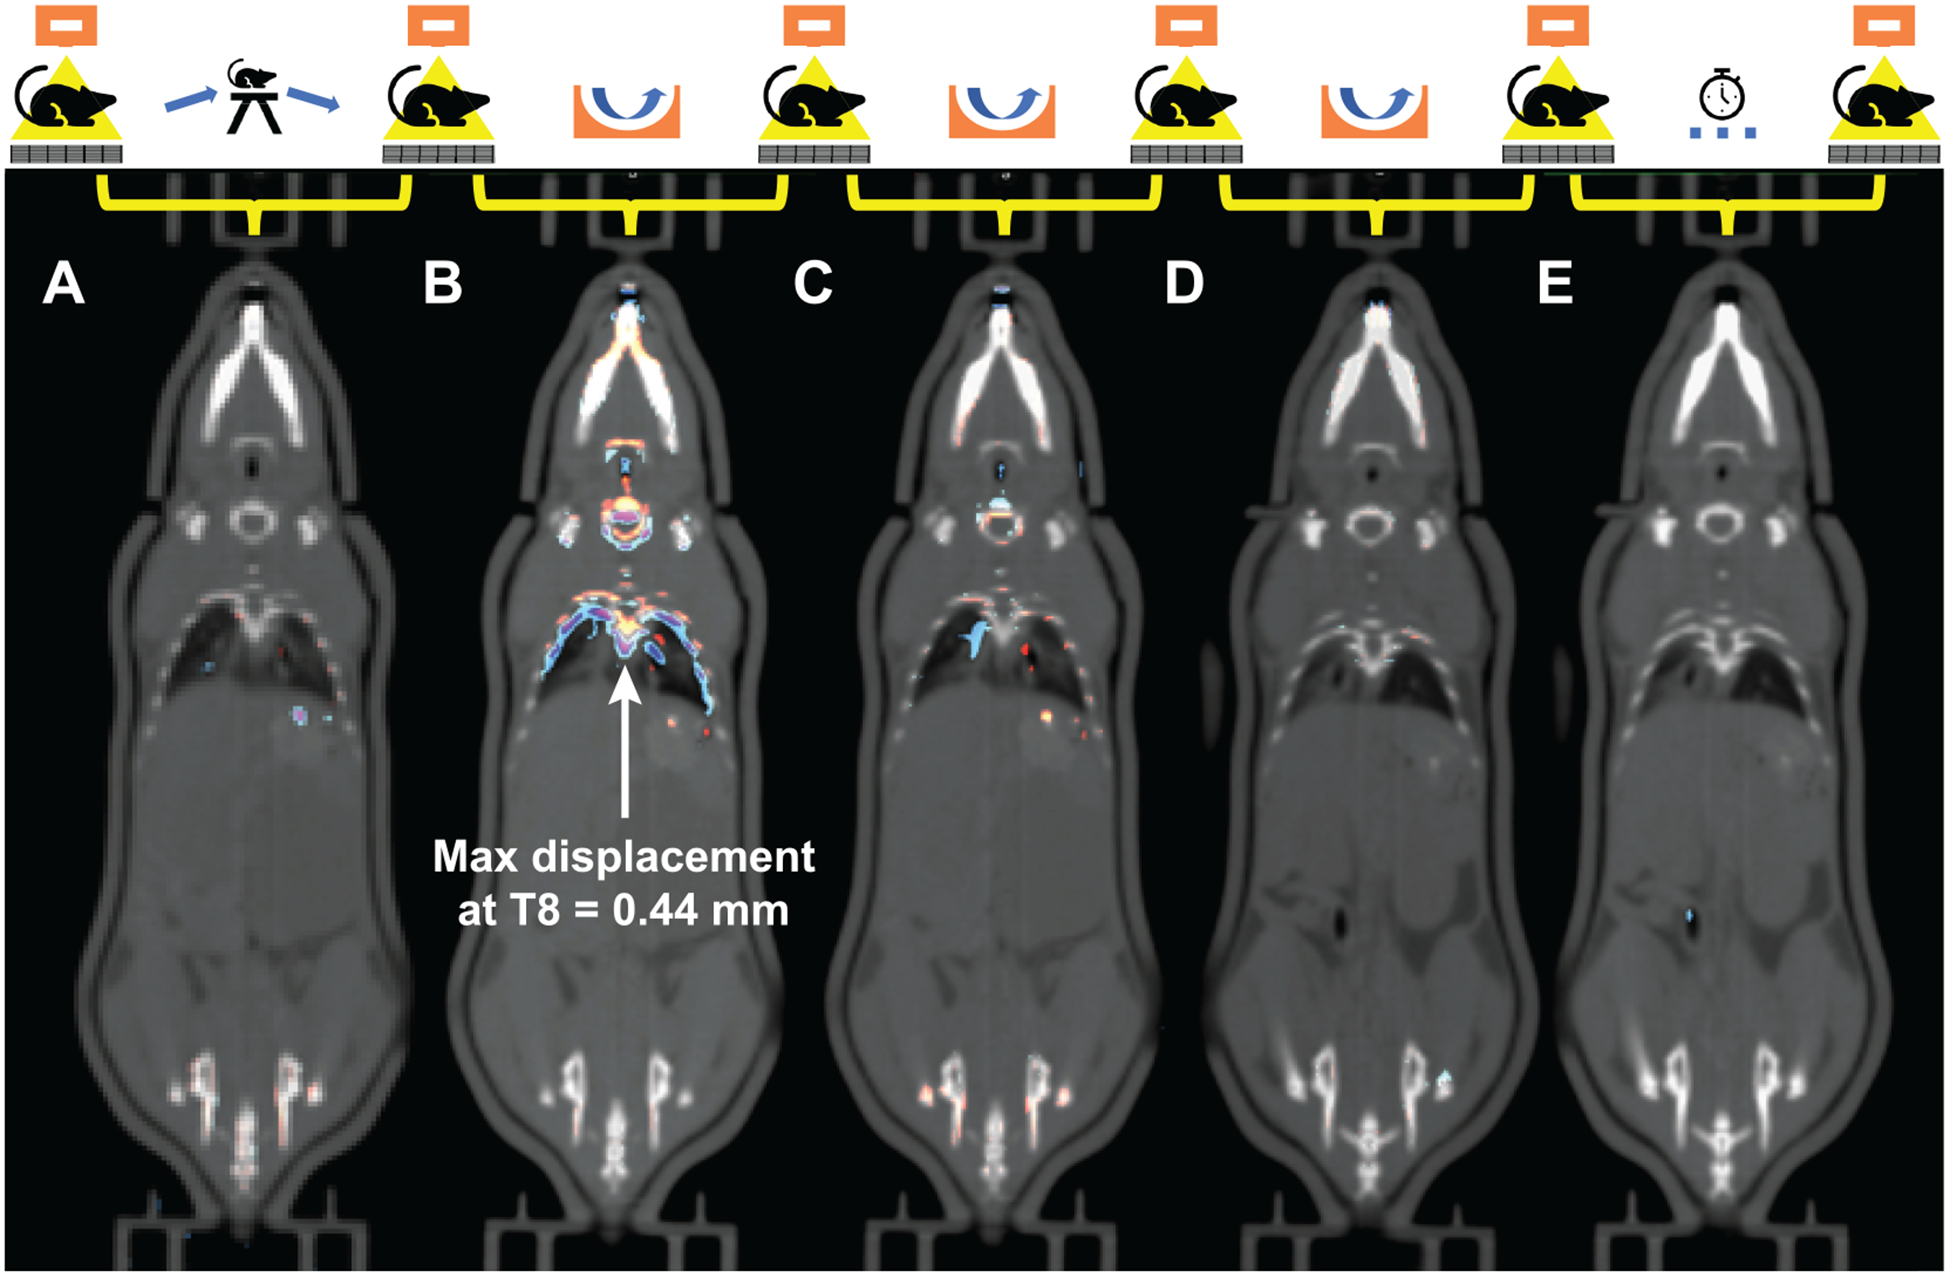
FIG. 4.

A representative analysis of anatomic displacements in one of the mice. Pairs of microCT images from before and after each intervention were rigidly registered using the immobilization mold as the reference. The interventions were: (A) Moving the BCAM-immobilized mouse out of the scanner and back without rotation; (B–D) Three halfpipe ramp rolls; and (E) Leaving the mouse in place for 5 min. The difference maps are superimposed on the images showing the normalized intensity differences from the initial (blue) to subsequent (red) scans. In this case, the largest displacement occurred with the first rotational intervention, but with the maximum displacement of any of the landmarks of only 0.44 mm at the T8 vertebra.
