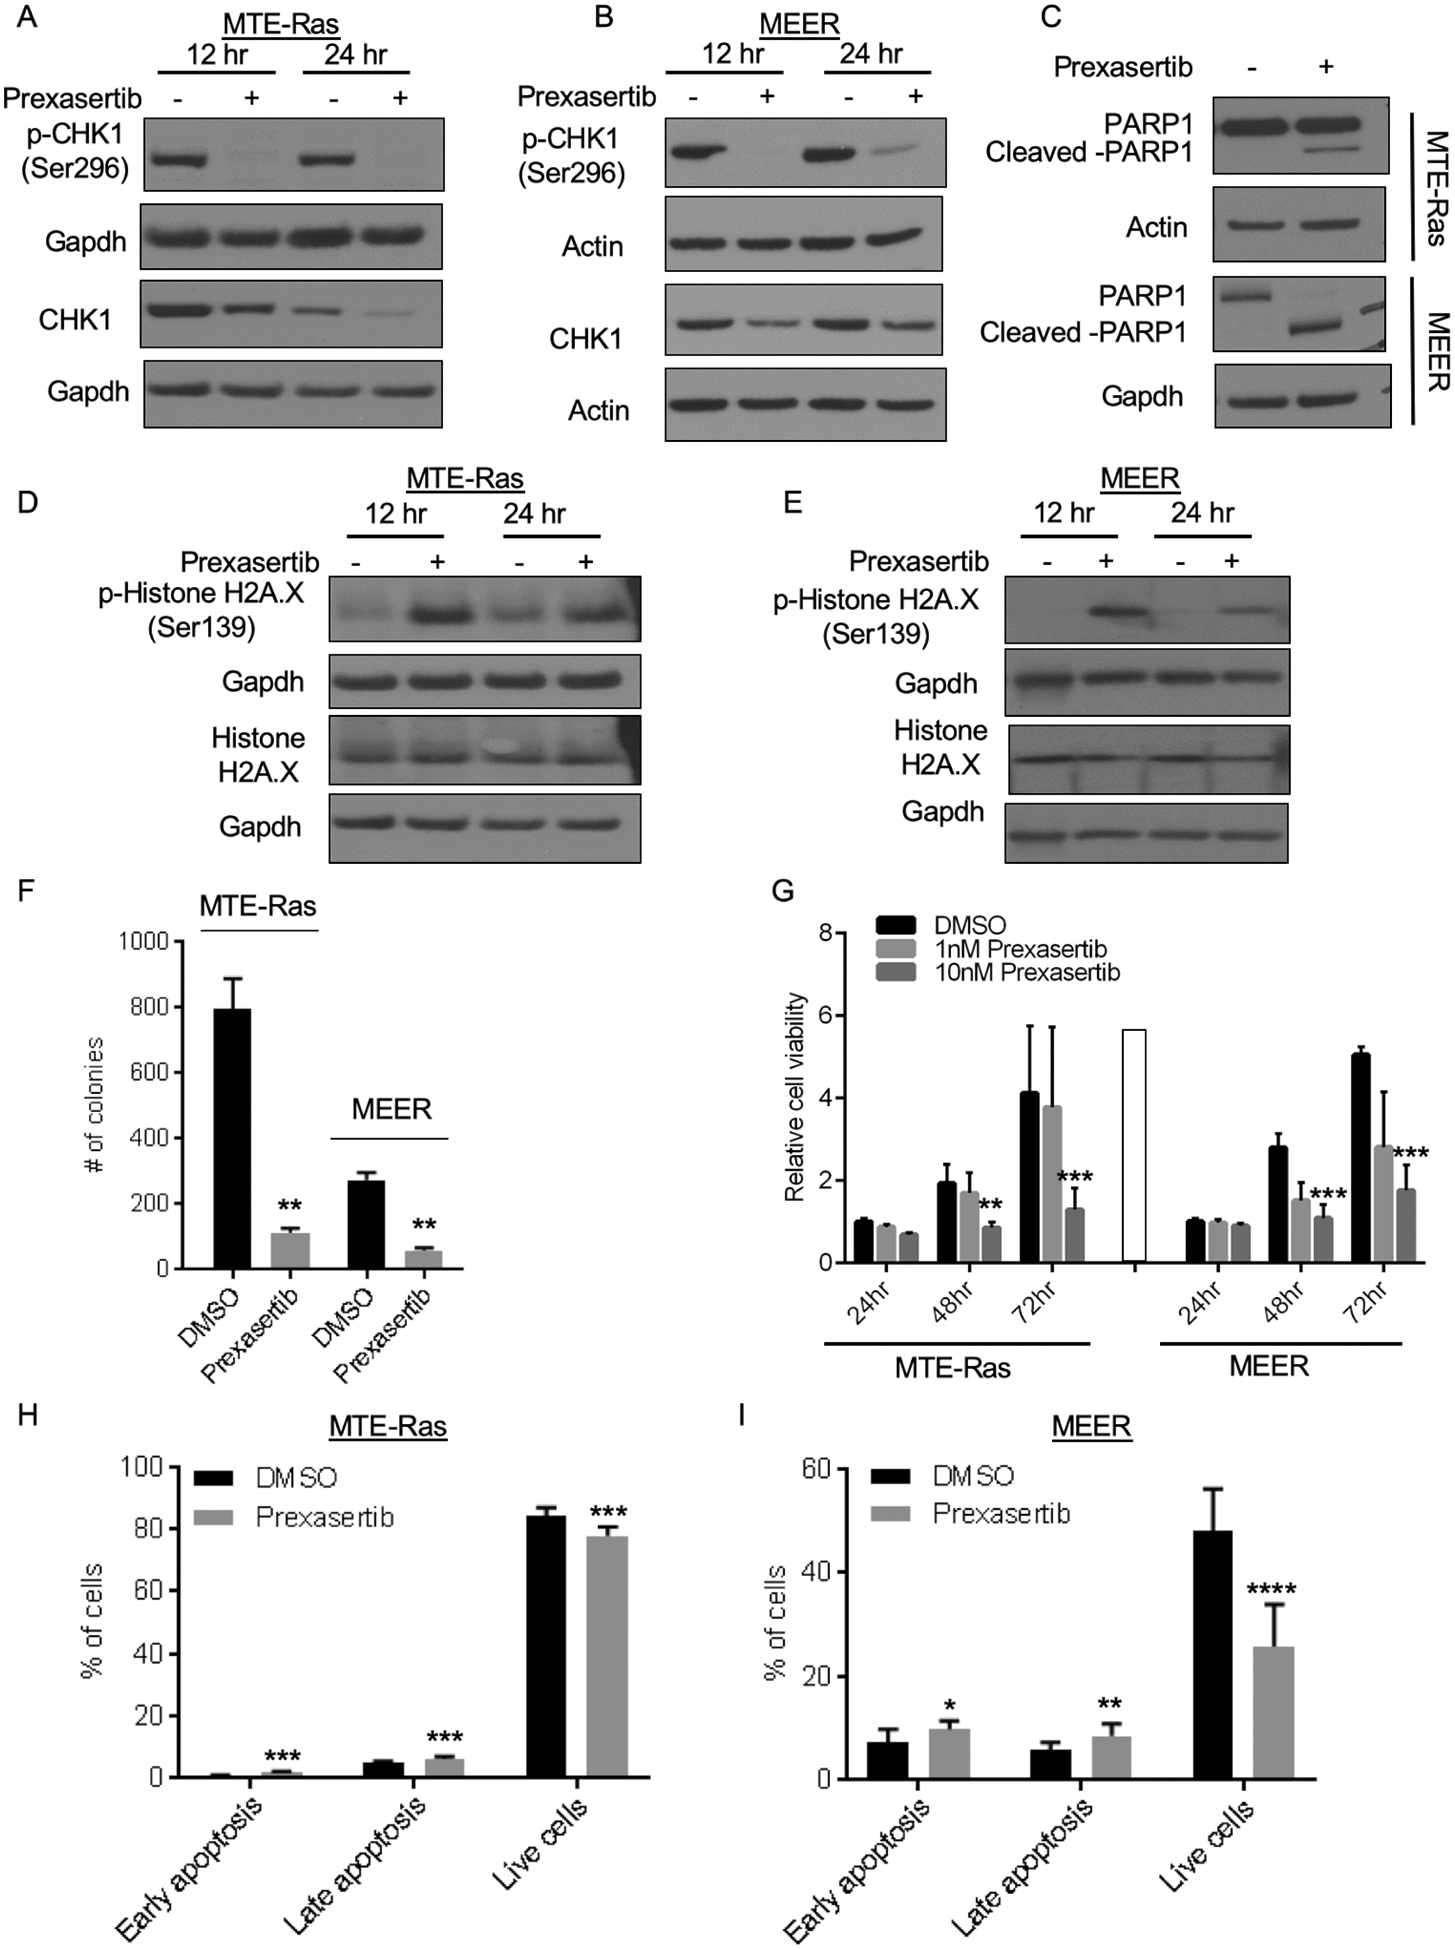
FIGURE 1.

Prexasertib causes DNA damage in the cancer cells. (A,B) Immunoblot analysis showing prexasertib is a CHK1 inhibitor and treatment with prexasertib abolished CHK1 activity as measured by reduced p-CHK1 (Ser296) in MTE-Ras (A) and MEER (B) cells. GAPDH and Actin are used a loading controls. (C) Immunoblot analysis shows that prexasertib induces DNA damage in MTE-Ras and MEER cells as measured by increased levels of PARP1 (C) and p-Histone H2A.X (D,E) These are representative western blots from at least 3 biological replicates. (F) MTE-Ras or MEER cells were treated with DMSO or 10nM prexasertib for 24 hours and colony formation assays were performed. Error bars represent standard deviation (SD) from three independent wells of a representative biological replicate. (G) Cell proliferation assays were performed by treating MTE-Ras or MEER cells with DMSO or 1nM or 10nM prexasertib for the indicated times. Error bars represent SD from four biological replicates and each biological replicate had four technical replicates. (H,I) MTE-Ras cells were treated with DMSO or 10nM prexasertib and MEER cells were treated with DMSO or 5nM prexasertib for 48 hours and the percentage of apoptotic cells was determined by performing Annexin V staining in conjunction with PI staining followed by FACS analysis. Error bars represent SD from three biological replicates and each biological replicate had three-four technical replicates.
The P values were determined by performing paired t test (F) or 2way ANOVA (G) or Welch’s t test (H,I). *p<0.05; ** p<0.01; ***p<0.0001.
