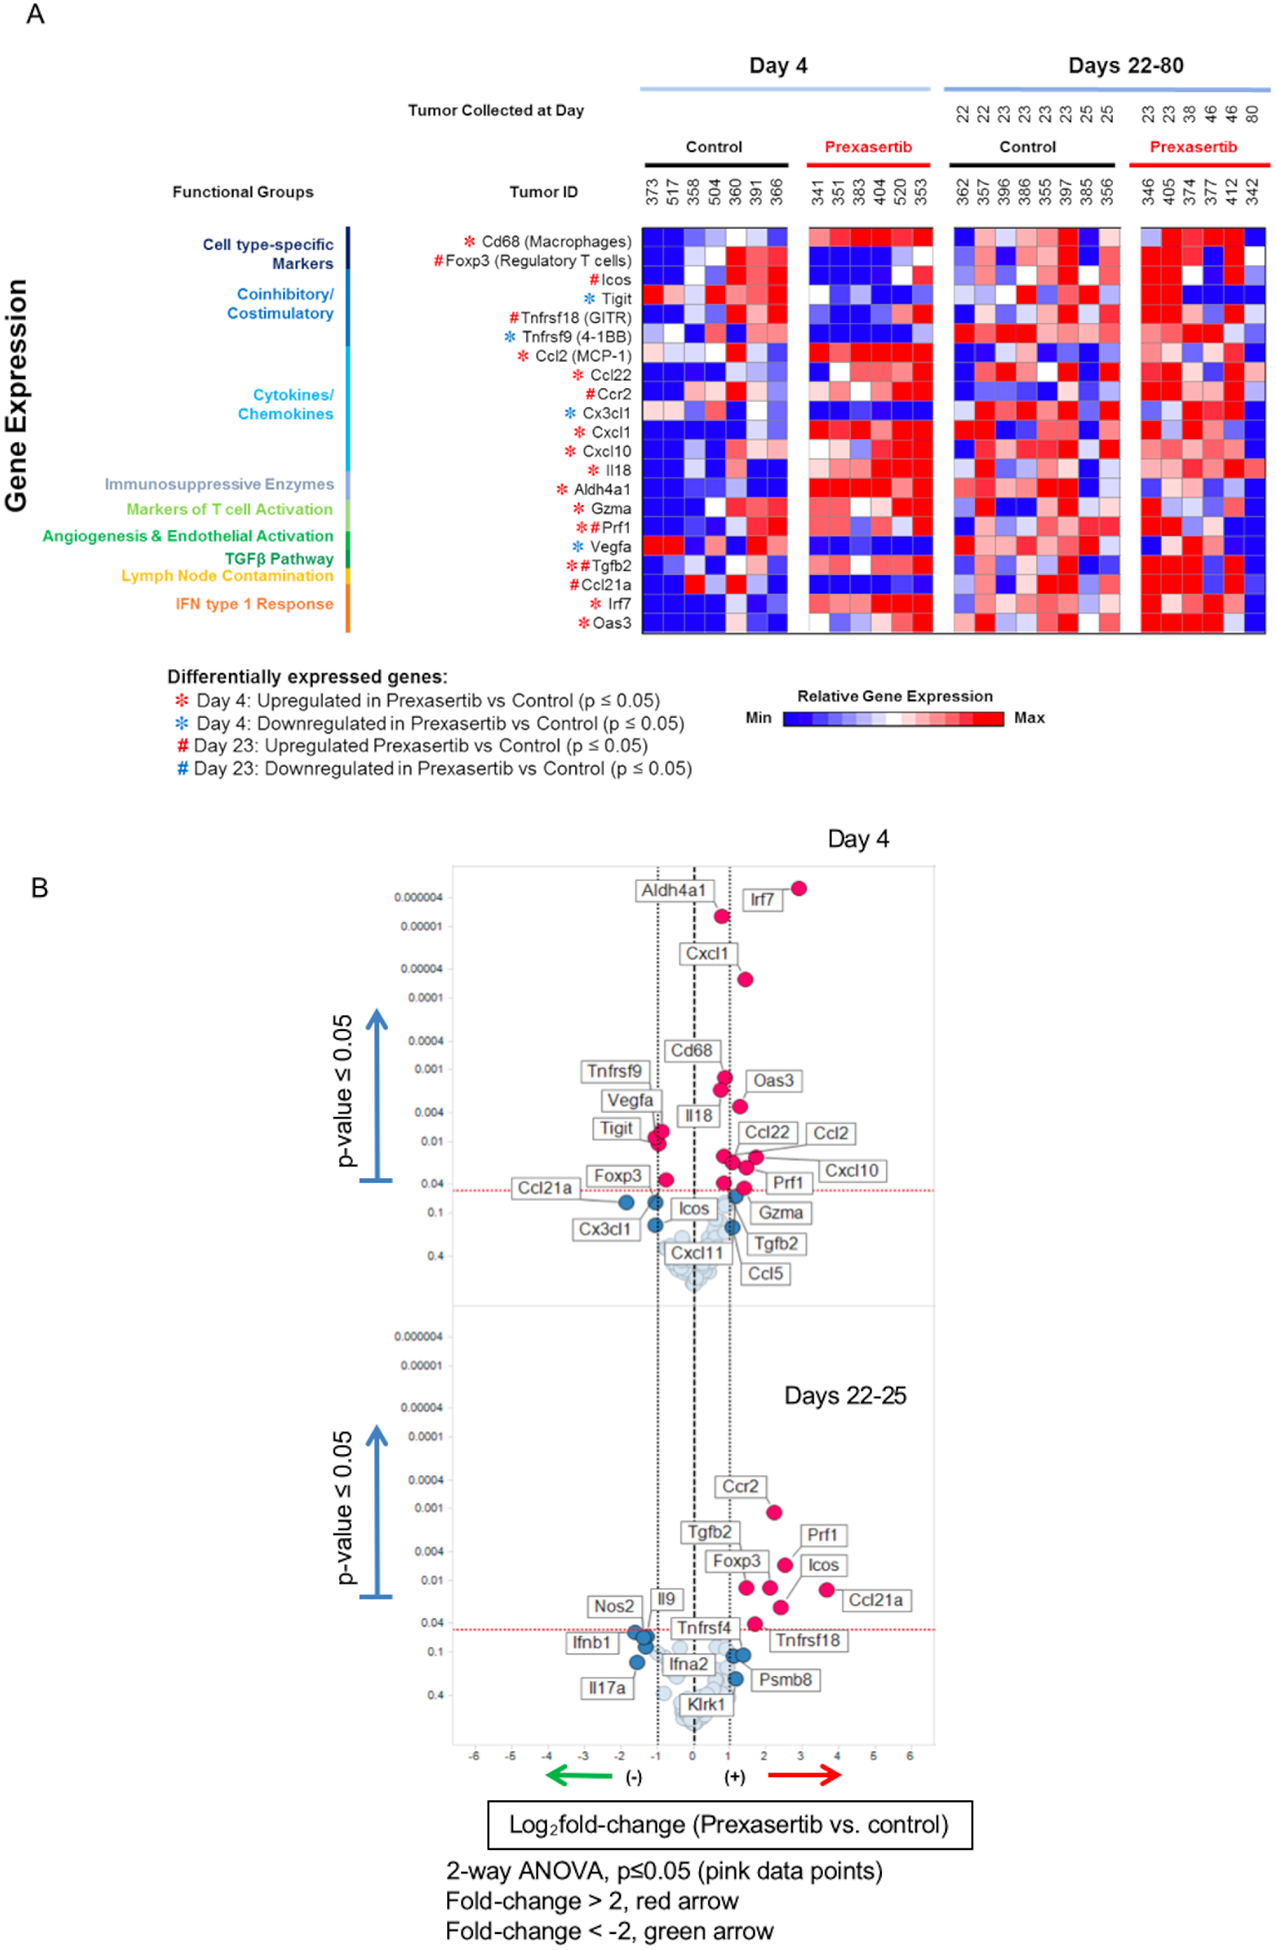
FIGURE 3.

Overview of immune-related prexasertib resistance signature. (A) Heat map showing gene expression results from mice tumors treated with control or prexasertib. The set of 21 gene presented here is defined as immune-related prexasertib resistance signature. Tumor samples were collected at Day 4 and Days 22–80 and expression analysis was performed based on immune profiling Quantigene Plex panel. (B) Volcano plots show log2 fold-change of gene expression in the prexasertib vs control groups with differentially expressed genes that display greater than 2-fold difference with p < 0.05 (two-way ANOVA) compared with control group.
