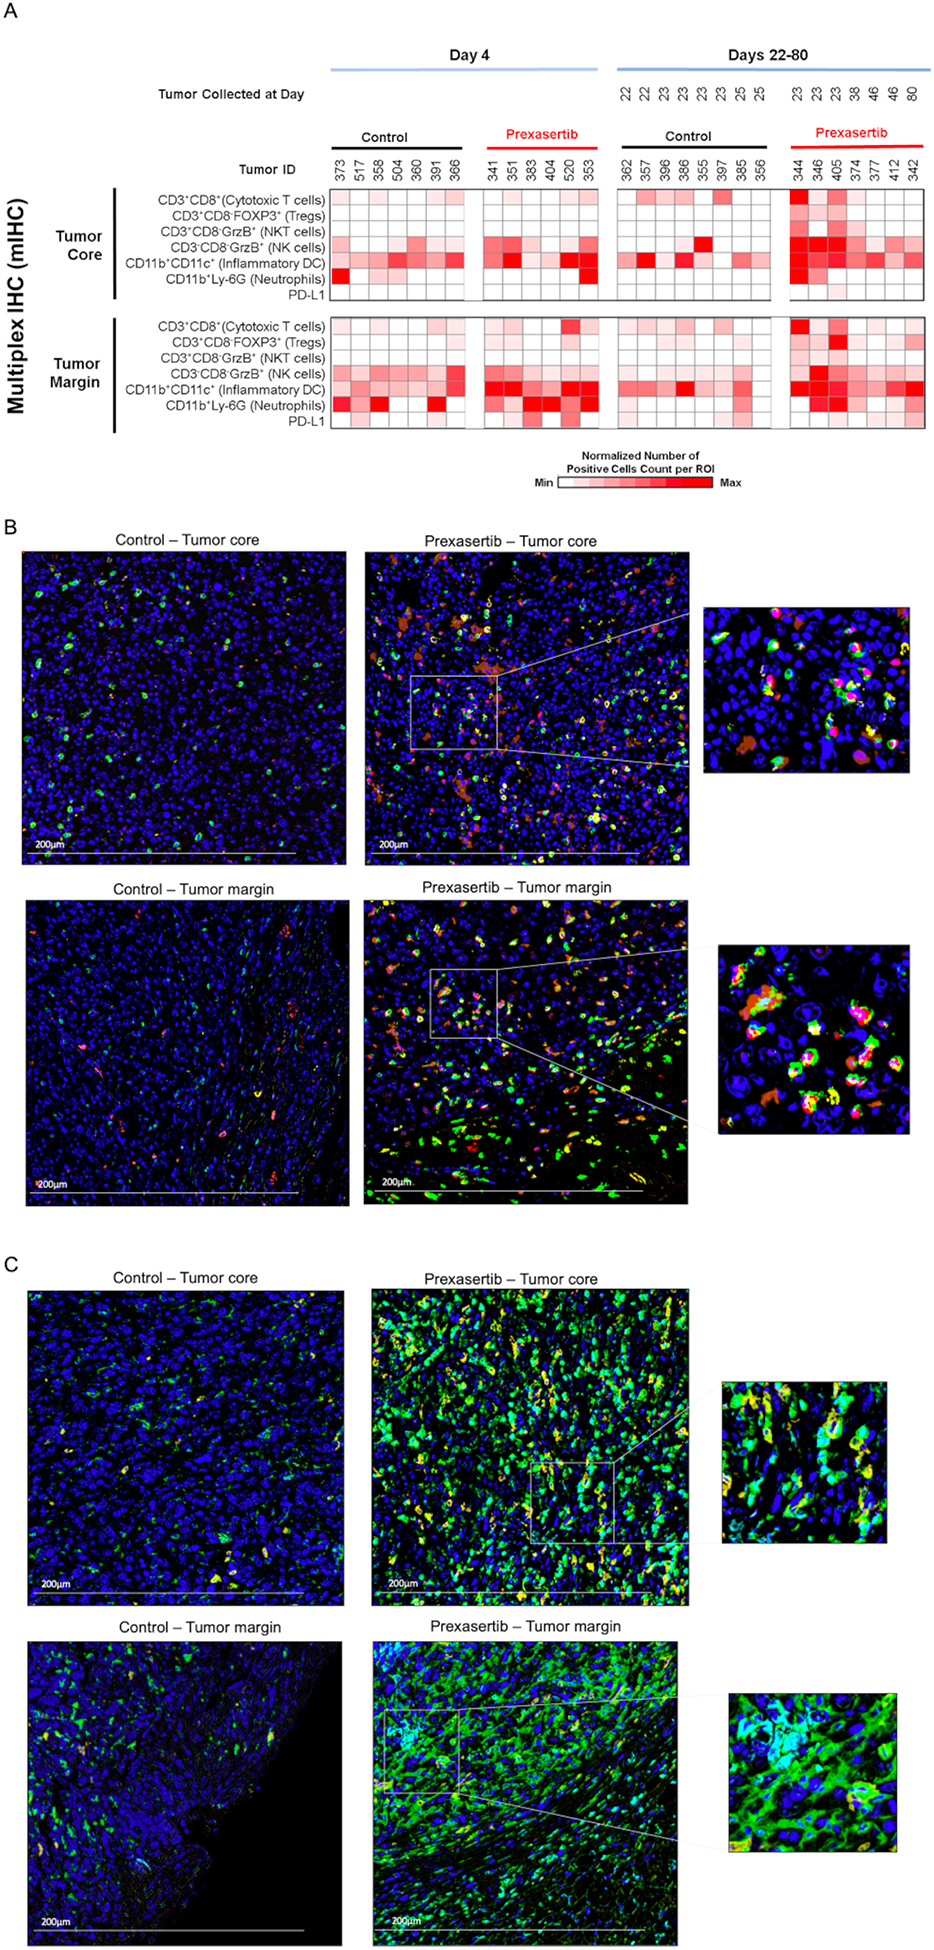
FIGURE 4.

Prexasertib treatment increases tumor infiltration of lymphoid and myeloid immune markers as measured by mIHC analysis. (A) Heat map showing quantification of mIHC signal (as described in the methods section) from mice tumors treated with control or prexasertib and the samples were collected at indicated times. (B,C) Representative images of mIHC staining demonstrating lymphoid (B) and myeloid (C) markers. Tumor core (top panels) and margin (bottom panels) with lymphocyte density from control mice and prexasertib treated mice. A representative enlarged area is presented to show overlapping markers. All images are at 20x magnification, and the scale bar is 200 μm. The colors represent the following staining for lymphoid markers (B) blue = nuclei (hematoxylin), green = CD3, yellow = CD8, red=FOXP3, brownish orange = GrzB; for myeloid markers (C) blue = nuclei (hematoxylin), green = CD11b, yellow = CD11c, cyan=LY-6G.
