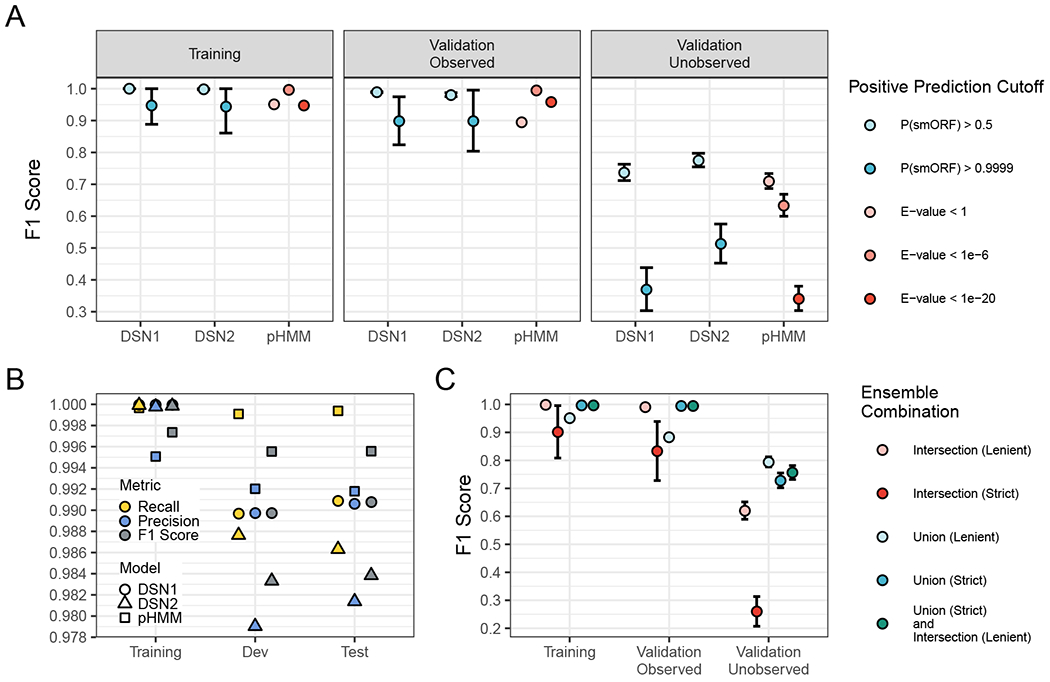
Figure 1: Deep learning models detect unobserved smORF families with greater recall and F1 score than profile HMM models.

(A) Each point is the average value after running the training procedure 64 times with randomly selected families excluded from the training set and assigned to the “Validation - Unobserved Families” set. Showing F1 Score (the weighted average of precision and recall) for the three sets with different significant cutoffs. Data are represented as mean ± SEM. (B) The F1 Score, Recall, and Precision of the final DSN1, DSN2, and pHMM models. A positive prediction cutoff of P(ORF) > 0.5 was used for DSN, and a cutoff of E-value < 1e-6 was used for pHMM. (C) The average F1 score of various ensemble model combinations across sets. “Intersection (Lenient)” indicates that all positive predictions met the lenient significance cutoffs (pHMM E-value < 1, DSN1 P(smORF) > 0.5, and DSN2 P(smORF) > 0.5), “Intersection (Strict)” indicates that all positive predictions met the strict significance cutoffs (pHMM E-value < 1e-6, DSN1 P(smORF) > 0.9999, and DSN2 P(smORF) > 0.9999), “Union (Lenient)” indicates that at least one of the three models met the lenient significance cutoffs, and “Union (Strict)” indicates that at least one of the three models met the strict significance cutoffs. See also Figure S1, Figure S2 and Table S2.
