
Figure 2: Predicted smORFs are enriched for Ribo-Seq signal.
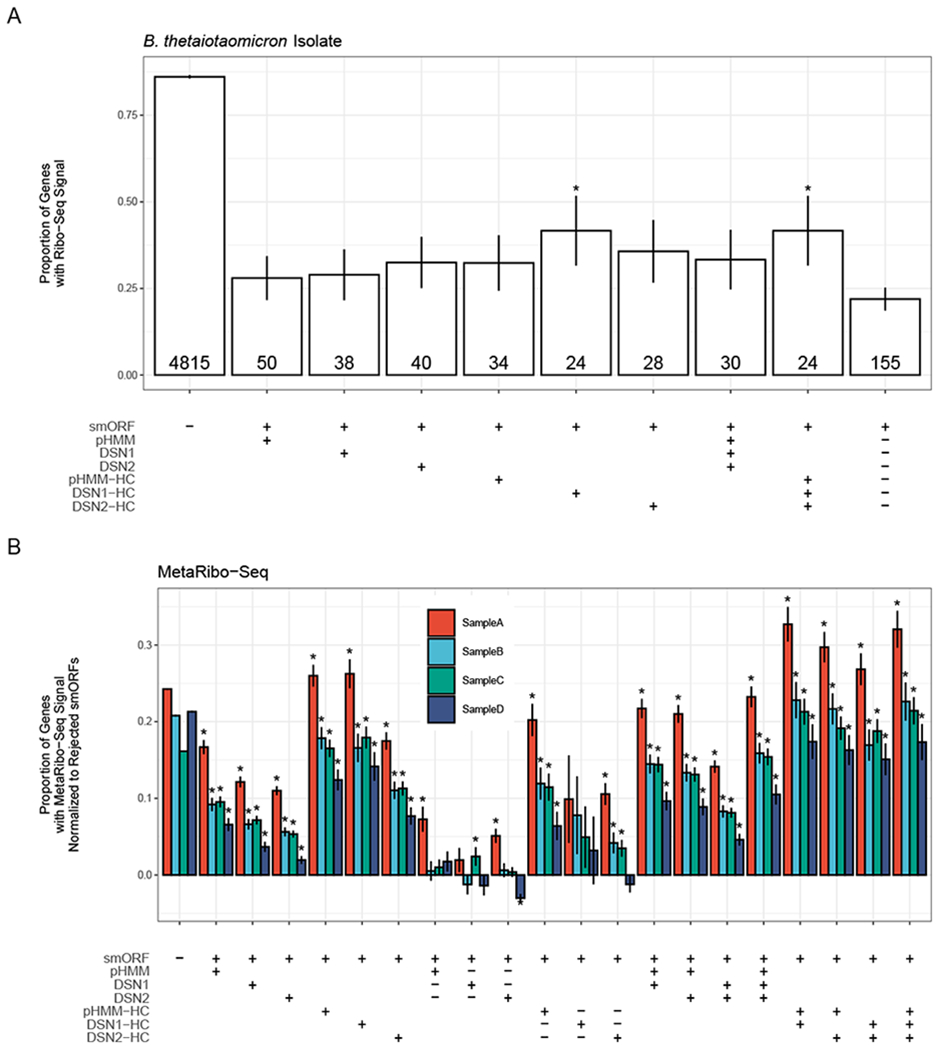
(A) The proportion of genes with Ribo-seq signal (RPKM ≥ 0.5) in different gene sets in a Bacteroides thetaiotaomicron isolate. Table along the x-axis denotes the genes included in each set. The label “smORF” indicates if set includes smORFs (+) or only non-smORFs (−), “pHMM” indicates that the set includes pHMM-predicted smORFs at E-value < 1.0 (+), “DSN1” indicates the set includes DSN 1-predicted smORFs at P(ORF) > 0.5 (+), “DSN2” indicates the set includes DSN2-predicted smORFs at P(ORF) > 0.5 (+), “pHMM-HC” indicates the set includes pHMM-predicted smORFs at E-value < 1e-6 (+), “DSN1-HC” indicates the set includes DSN1-predicted smorfs at P(ORF) > 0.9999, and “DSN2-HC” indicates the set includes DSN2-predicted smorfs at P(ORF) > 0.9999. If multiple “+” symbols are found in a column, then that means all genes in the set meet each cutoff. The symbol “−” indicates that all genes meeting the specified cutoff were excluded from the set. The final column indicates all smORFs that were not predicted by any model to be a true smORF at any significance cutoff. Error bars indicate the standard error of each proportion. These smORFs are referred to as “Rejected smORFs”. The number of total genes in each gene set is given at the bottom of each bar. Asterisks indicate that the proportion is significantly higher (P < 0.05) in the specified set than in the “Rejected smORFs” set. (B) The proportion of genes with MetaRibo-seq signal (RPKM ≥ 0.5), normalized to rejected smORF MetaRibo-Seq signal, in different gene sets in four different MetaRibo-seq samples. Normalization was performed by subtracting the proportion of rejected smORFs with a MetaRibo-Seq signal from the proportion of genes in each set with MetaRibo-Seq signal. The x-axis table is the same as the one shown in (A) with additional gene sets added. For example, one additional column is the 8th column from the left, designated by “smORF = +”, “pHMM = +”, “DSN1 = −” and “DSN2 = −” indicates the set of smORFs with predicted by the pHMM model to be a true smORF, but predicted by both DSN1 and DSN2 to be a false smORF. Asterisks indicate that the proportion is significantly higher (P < 0.05) in the specified set than in the “Rejected smORFs” set. See also Figure S3.