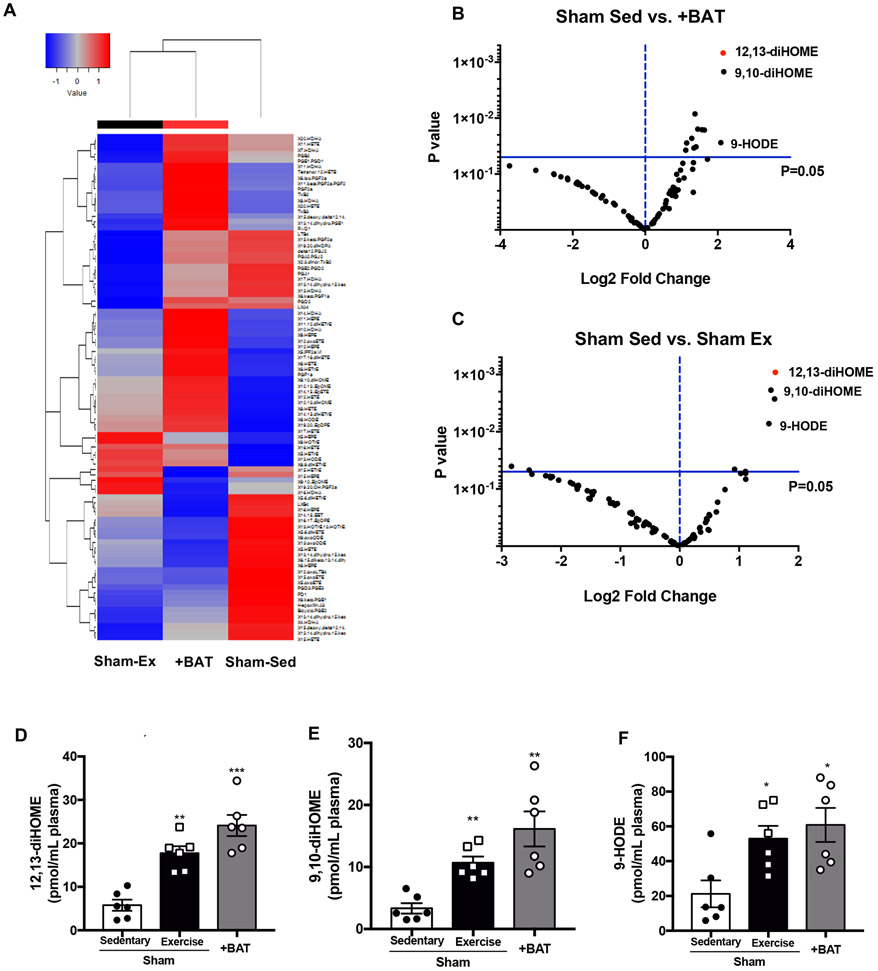
Figure 2. Exercise or transplantation of BAT increases circulating 12,13-diHOME, 9,10-diHOME, and 9-HODE.
(A) Heat map and (B,C) volcano plot representing 88 lipids comparing the fold induction of Sham-Sedentary to the p value; 12,13-diHOME is circled in red. Data are mean ± S.E.M (n=6/group). Plasma concentrations of (D) 12,13-diHOME, (E) 9,10-diHOME, and (F) 9-HODE. Data are mean ± S.E.M (n=6/group). Asterisks represent difference vs. Sham-Sedentary (*P<0.05; **P<0.01; ***P<0.001). One-way ANOVA was used for C, D, and E with Tukey’s multiple comparisons tests.

