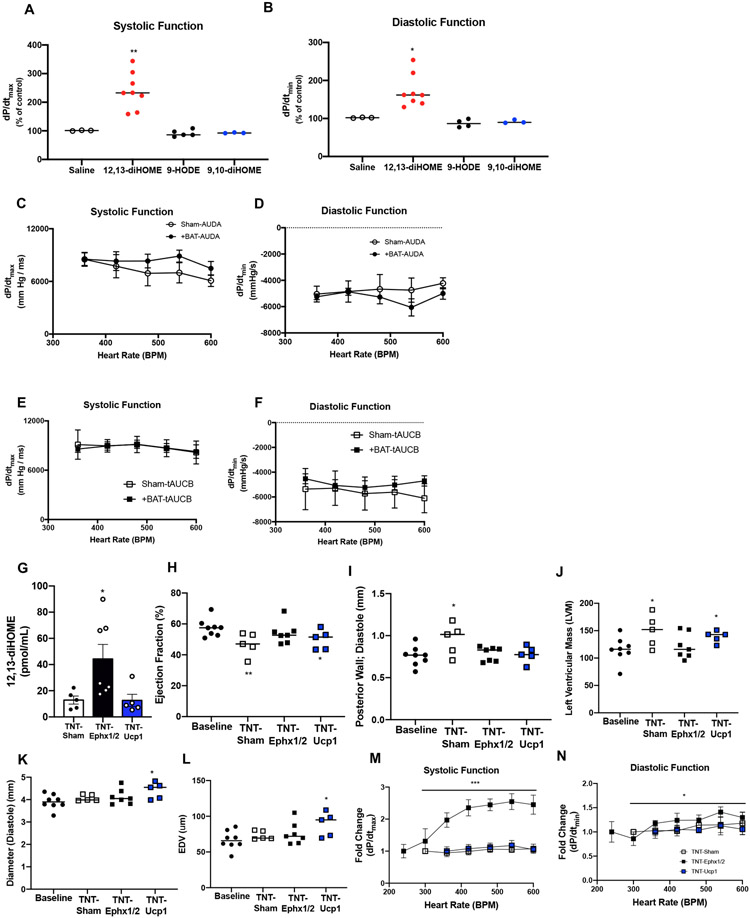
Figure 3. 12,13-diHOME improves in vivo cardiac function and structure.
(A) Systolic and (B) diastolic function in mice acutely injected with saline (n=3), 12,13-diHOME (n=8), 9-HODE (n=5), or 9,10-diHOME (n=3). Data are mean ± S.E.M Asterisks represent difference compared to mice injected with saline, 9-HODE, or 9,10-diHOME (*P<0.05; **P<0.01). (C) Systolic and (D) diastolic function measured by in vivo cardiac hemodynamics in Sham or +BAT mice fed the sEH inhibitor AUDA. (E) Systolic and (F) diastolic function measured by in vivo cardiac hemodynamics in Sham or +BAT mice fed the sEH inhibitor t-AUCB. Data are mean ± S.E.M (n=6/group). (G) 12,13-diHOME in Baseline (n=8), Sham (n=5), TNT-Ephx1/2 (n=7), or TNT-Ucp1 (n=5) mice. Data are mean ± S.E.M Asterisks represent difference compared to Sham (*P<0.05). Cardiac function and structure measured by (H) ejection fraction, (I) posterior wall thickness, (J) left ventricular mass, (K) diastolic diameter, and (L) end diastolic volume (EDV) was measured in Sham (n=5), TNT-Ephx1/2 (n=7), or TNT-Ucp1 (n=5). Data are mean ± S.E.M Asterisks represent differences compared to baseline cohort (*P<0.05; **P<0.01). (M) Systolic function and (N) diastolic function measured by in vivo cardiac hemodynamics. Data are mean ± S.E.M Asterisks represent difference in TNT-Ephx1/2 compared to all other groups (*P<0.05; **P<0.01; ***P<0.001). Repeated measures two-way ANOVA was used for C, D, E, F, M, and N with Tukey’s multiple comparisons tests. One-way ANOVA was used for G, H, I, J, K, and L with Tukey’s multiple comparisons tests. Kruskal-Wallis test was used for A and B.

