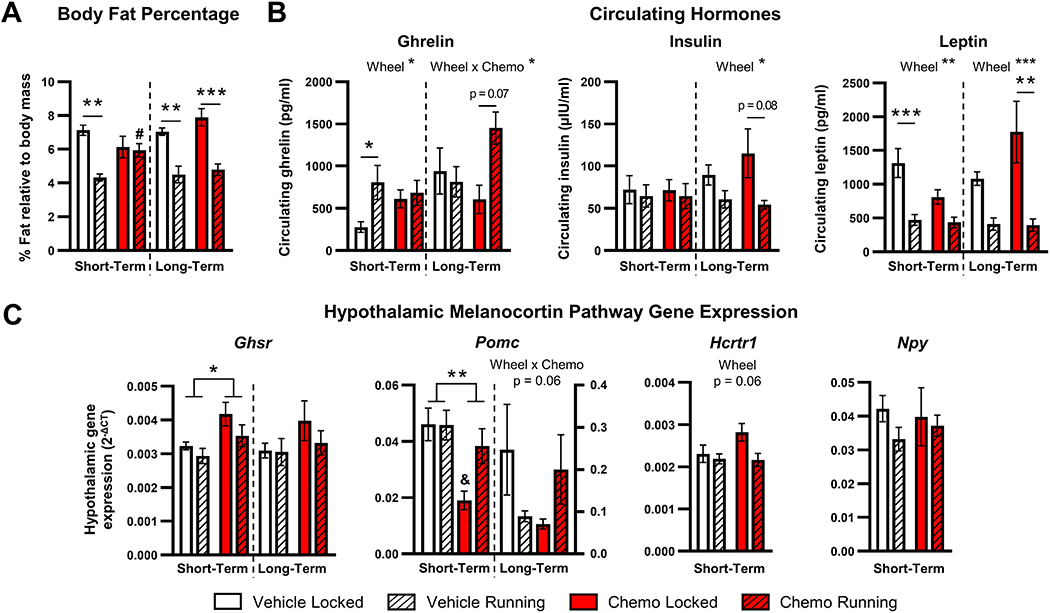
Figure 6. Peripheral and central mediators of appetite control following exercise intervention.

A. Body fat percentage as measured by Echo-MRI in mice 3 days (short-term) and 11 days (long-term) following the last dose of chemotherapy. B. Circulating hormones from short- and long-term groups of mice. C. Hypothalamic ghrelin receptor (Ghsr) and POMC (Pomc) gene expression from short- and long-term mice and orexin receptor (Hcrtr1) and NPY (Npy) in short-term mice. Total wheel revolutions were used as a covariate in all analyses to control for unequal exercise performance between vehicle and chemotherapy groups. *p < 0.05; **p < 0.01; ****p < 0.0001; #p < 0.05 between vehicle and chemotherapy running groups; &p < 0.05 between vehicle and chemotherapy locked groups.
