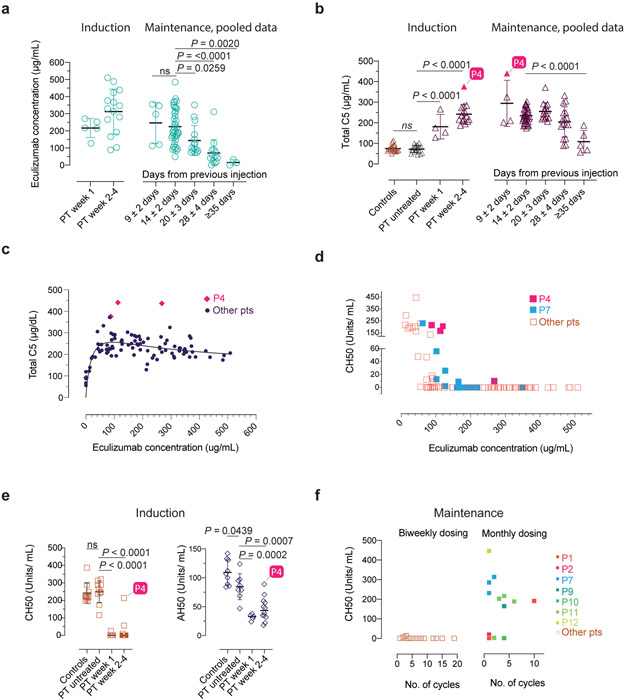
Fig. 3 ∣. Serum eculizumab concentration, total C5 and functional complement inhibition during the induction and maintenance phases of treatment.
a-b, Eculizumab and total C5 concentrations with respect to timing of therapy during the indicated periods. The respective exact P values comparing 9±2 vs. 14±2 days was 0.9803 (ns = not significant) in a, and controls vs untreated patients was 0.9926 (ns = not significant) in b. c-d, Pooled analyses of patient samples showing total C5 and CH50 levels across the range of eculizumab concentrations. e, CH50 and AH50 levels with respect to timing of therapy during the indicated periods. f, CH50 values with respect to number of cycles on the standard biweekly dosing intervals or the modified monthly-dosing regimen in selected cases. Error bars indicate mean and S.D. values. Multiple group comparisons were made by ordinary one-way ANOVA test. During post hoc analyses, Dunnett's multiple comparisons test analyzed differences between the standard 14 ± 2 days group with others in the maintenance pooled analyses in a and b, and patient (PT) untreated values with other groups in b and e, during the induction period, respectively. Adjusted P values for multiple testing are indicated. The P value comparing the controls vs untreated patients was 0.9795 (ns = not significant) in e. The number of samples investigated for each parameter were as follows: Total C5: 19 healthy controls and 114 samples from 15 CHAPLE patients; eculizumab concentrations: 96 samples from 15 patients; CH50: 14 healthy controls and 121 samples from 15 patients; AH50: 9 healthy controls and 25 samples from 13 patients. ECMb: eculizumab.

