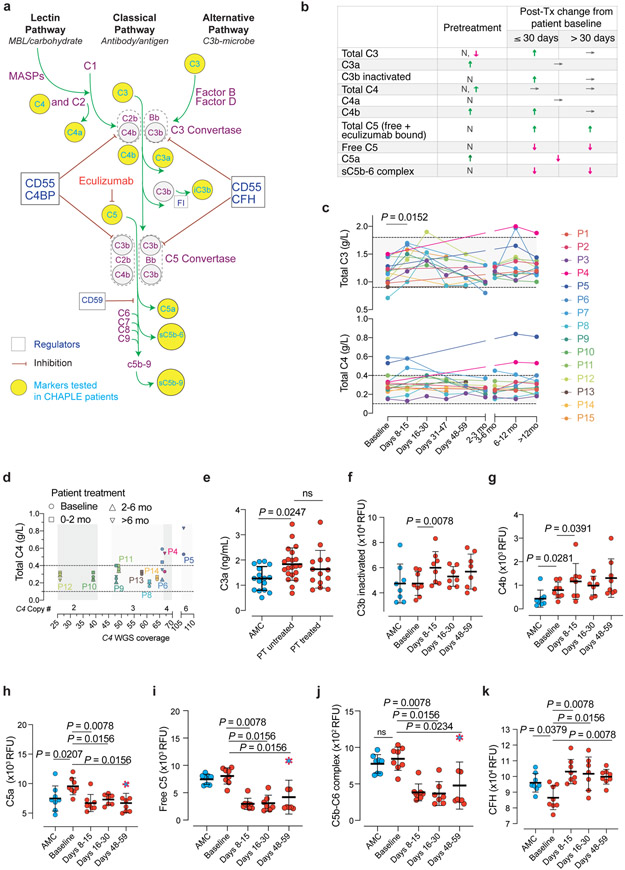
Fig. 4 ∣. Blood concentrations of complement proteins and their activated products before and during eculizumab treatment.
a, Pathway schematic of the complement system. iC3b = inactivated C3b, FI = complement factor I. CFH = Complement factor H. MASP = mannose-associated serine protease. b, Summary of alterations in selected circulating complement markers in CHAPLE patients. Arrows indicate the direction of change, if any: ↓(decrease), ↑(increase), or →(no change). N = Normal. c, Blood concentration in grams/liter (g/L) of intact C3 and C4, at baseline and during eculizumab treatment. Mean of repeated measurements at each time interval was plotted for individual patients. A mixed-effects model assessed the significance between values at different time points, with Tukey’s multiple comparisons test calculating adjusted P values for each pair (n = 15 patients). d, Serum C4 levels in relation to estimated Complement C4 gene copy numbers based on C4 WGS coverage. WGS: Whole-genome sequencing. In c and d, horizontal dashed lines show reference ranges. e-j, Blood concentration of complement products generated during complement activation at baseline and after eculizumab treatment. k, The soluble phase inhibitor CFH levels at baseline and during treatment. Statistics used to compare C3a between the three groups included an ordinary one-way ANOVA and the Tukey’s multiple comparisons test. Adjusted P values are indicated. Mann Whitney (for comparing AMC vs patient baseline values), and Wilcoxon matched-pairs signed rank tests (between patient baseline vs different post-treatment time points) analyzed the differences between groups in f-k (n = 8 control subjects and n = 8 patients, for each analysis). Red dashed symbols filled with blue in h-j indicate values that correspond to dropped eculizumab concentrations after dose skipping. All P values are two-sided. Sample size for C3a: 16 AMC, 21 untreated-, and 13 treated- patients. Error bars indicate mean and standard deviation. AMC= age-matched control.

