Figure 1. Pedigrees for the families that underwent WES, asterisk indicates the family members sequenced.
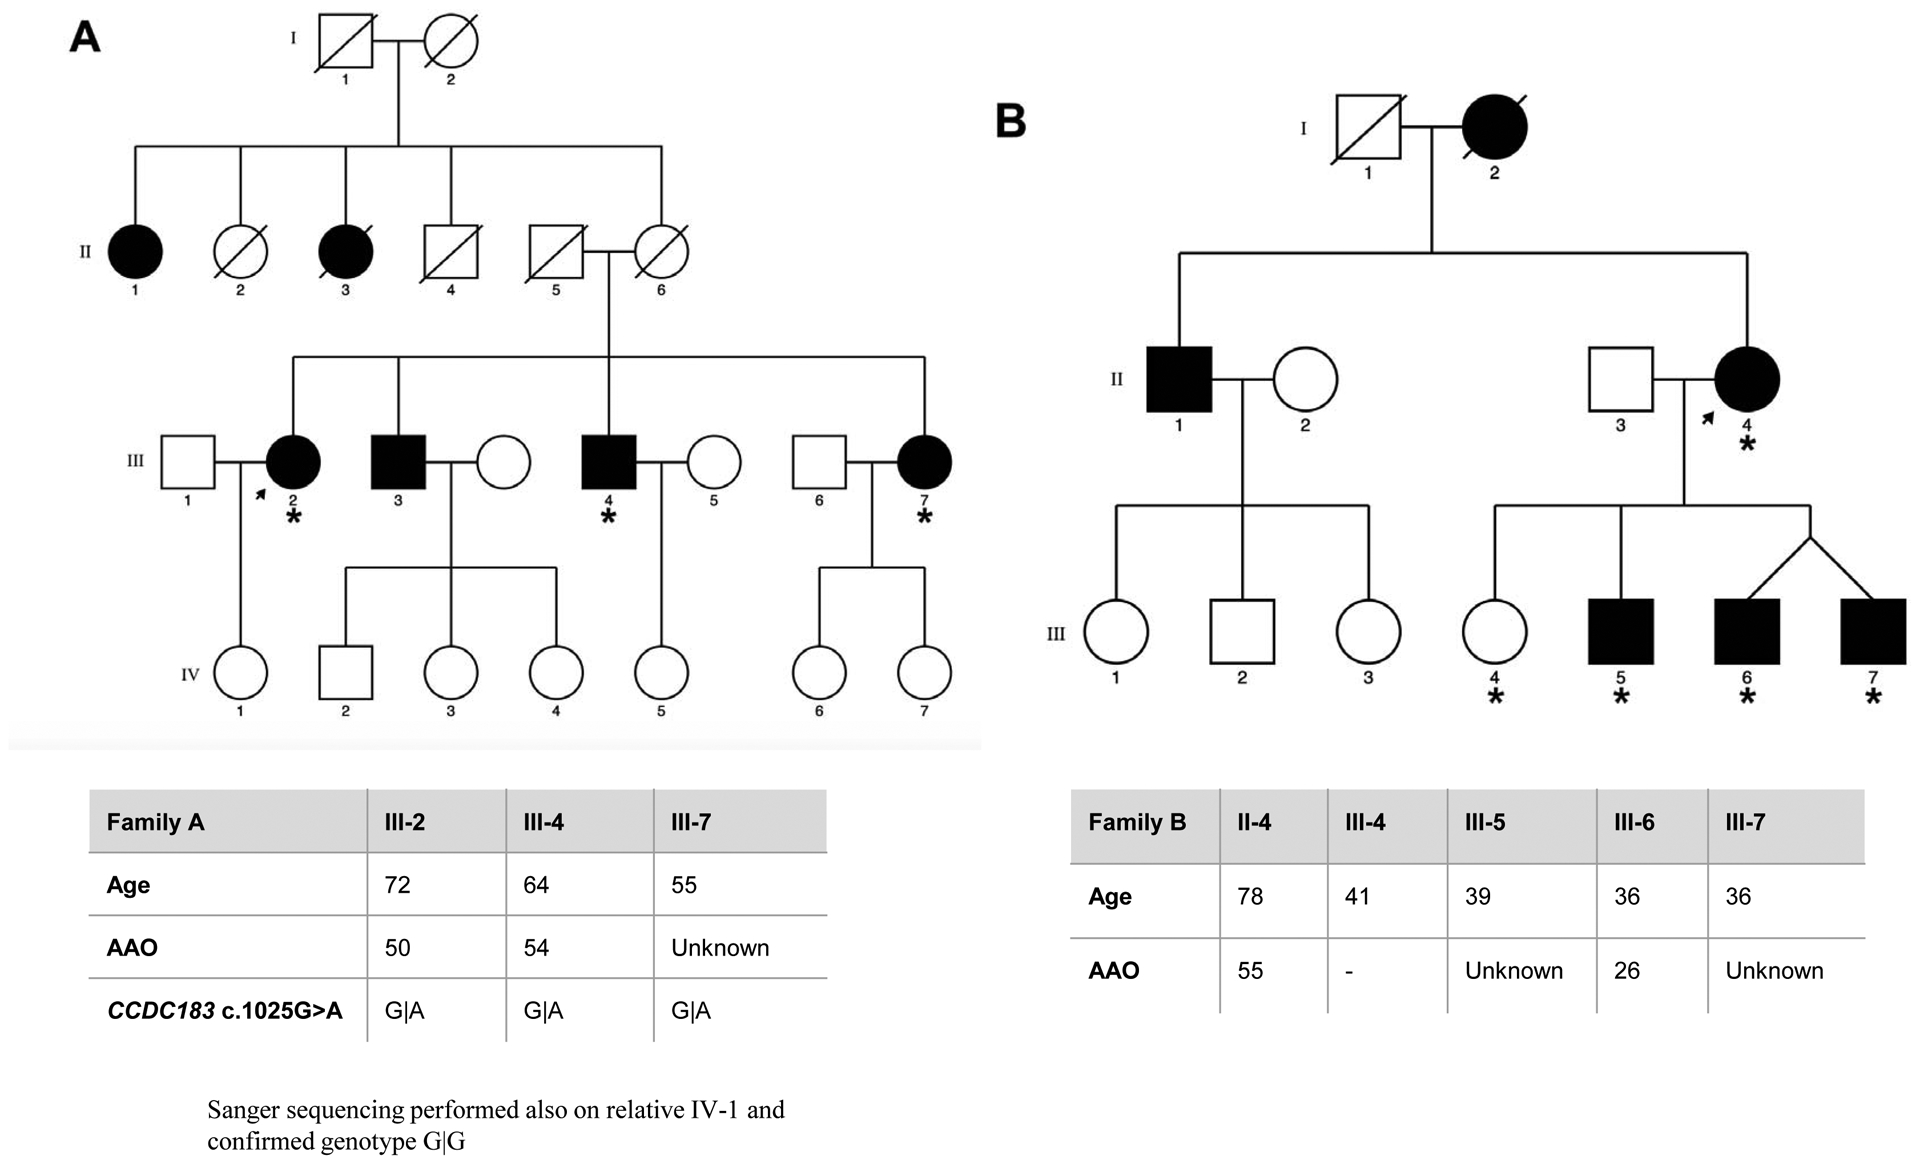
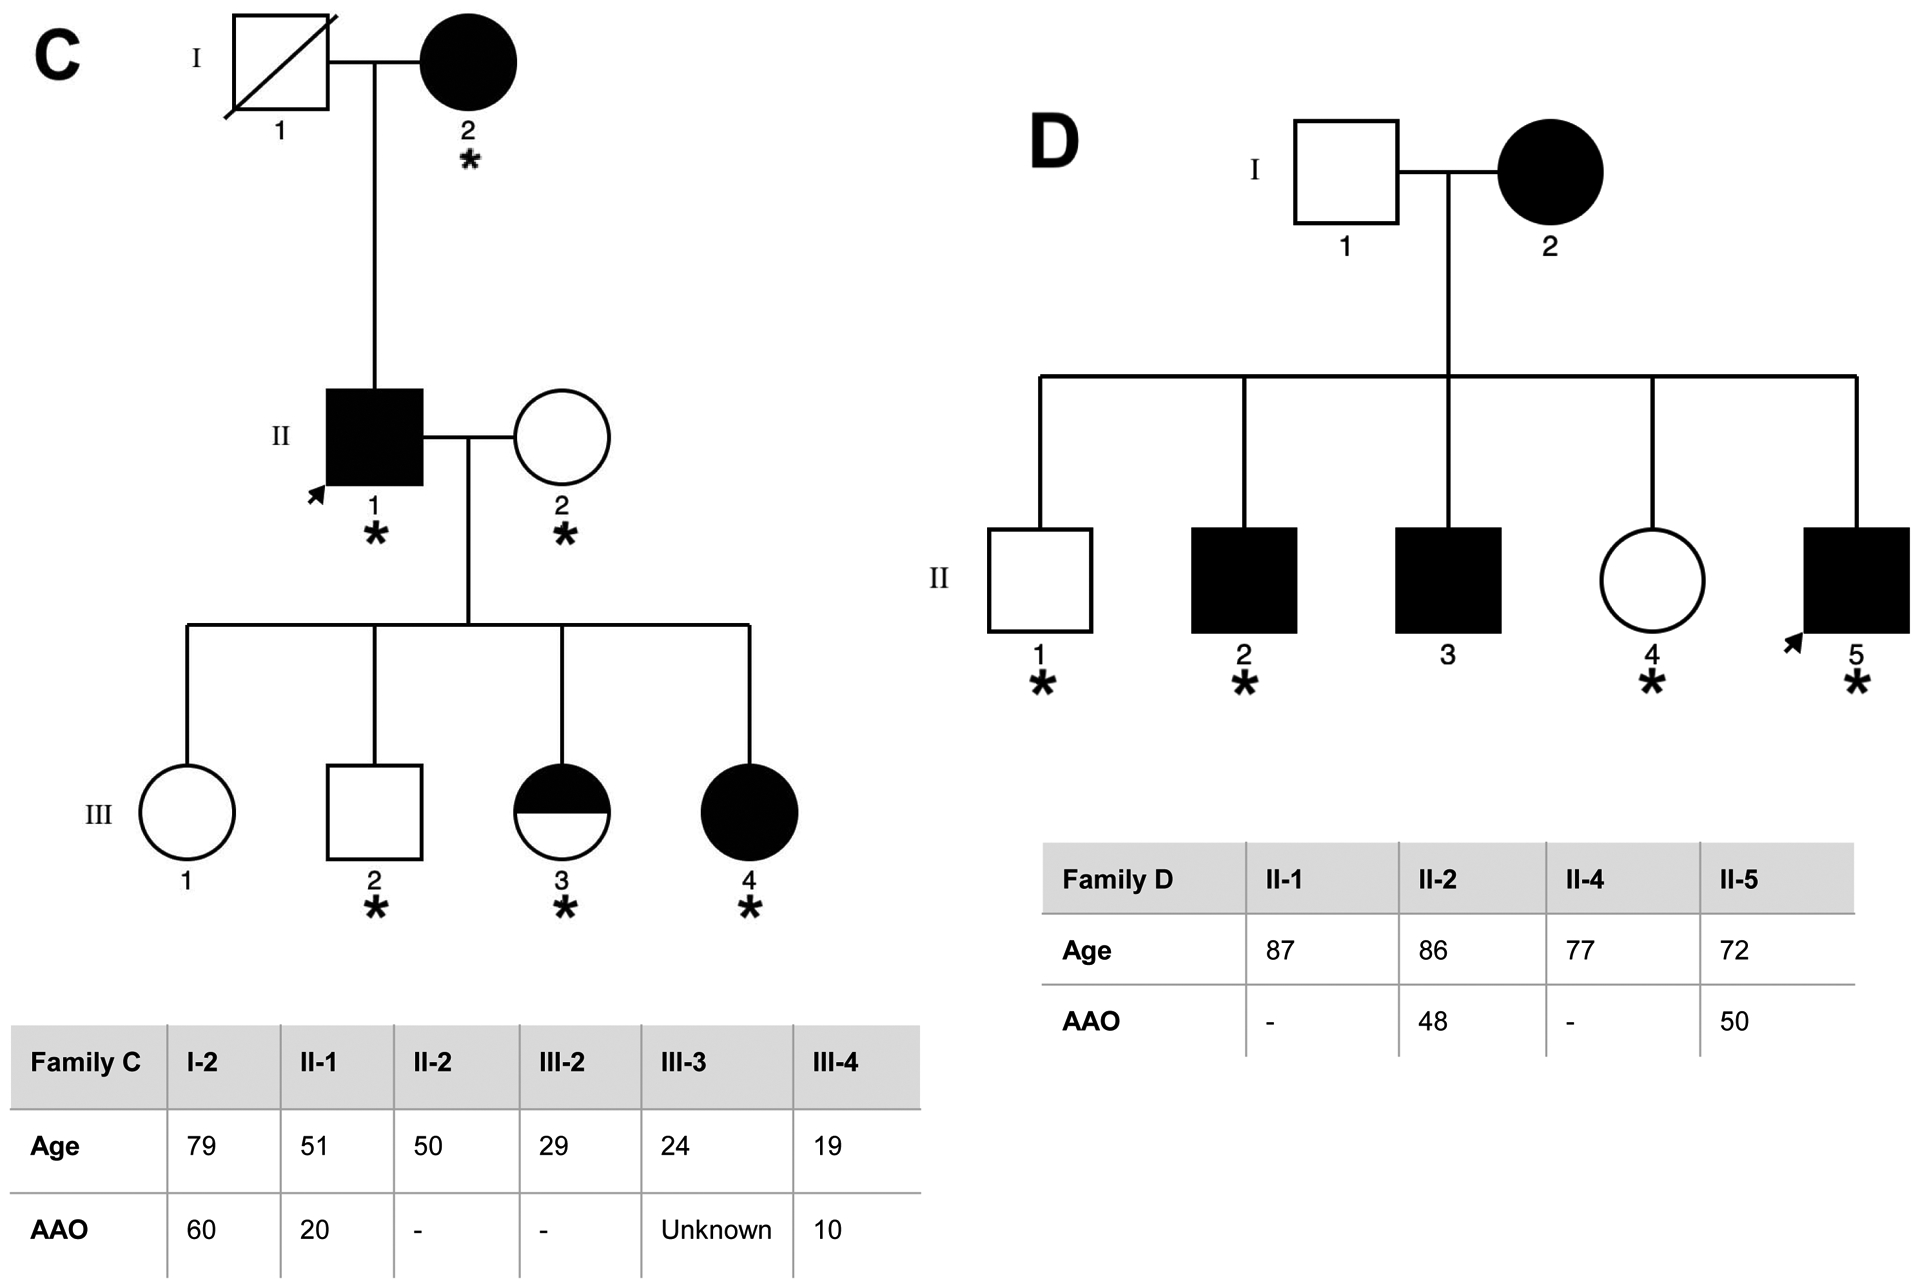
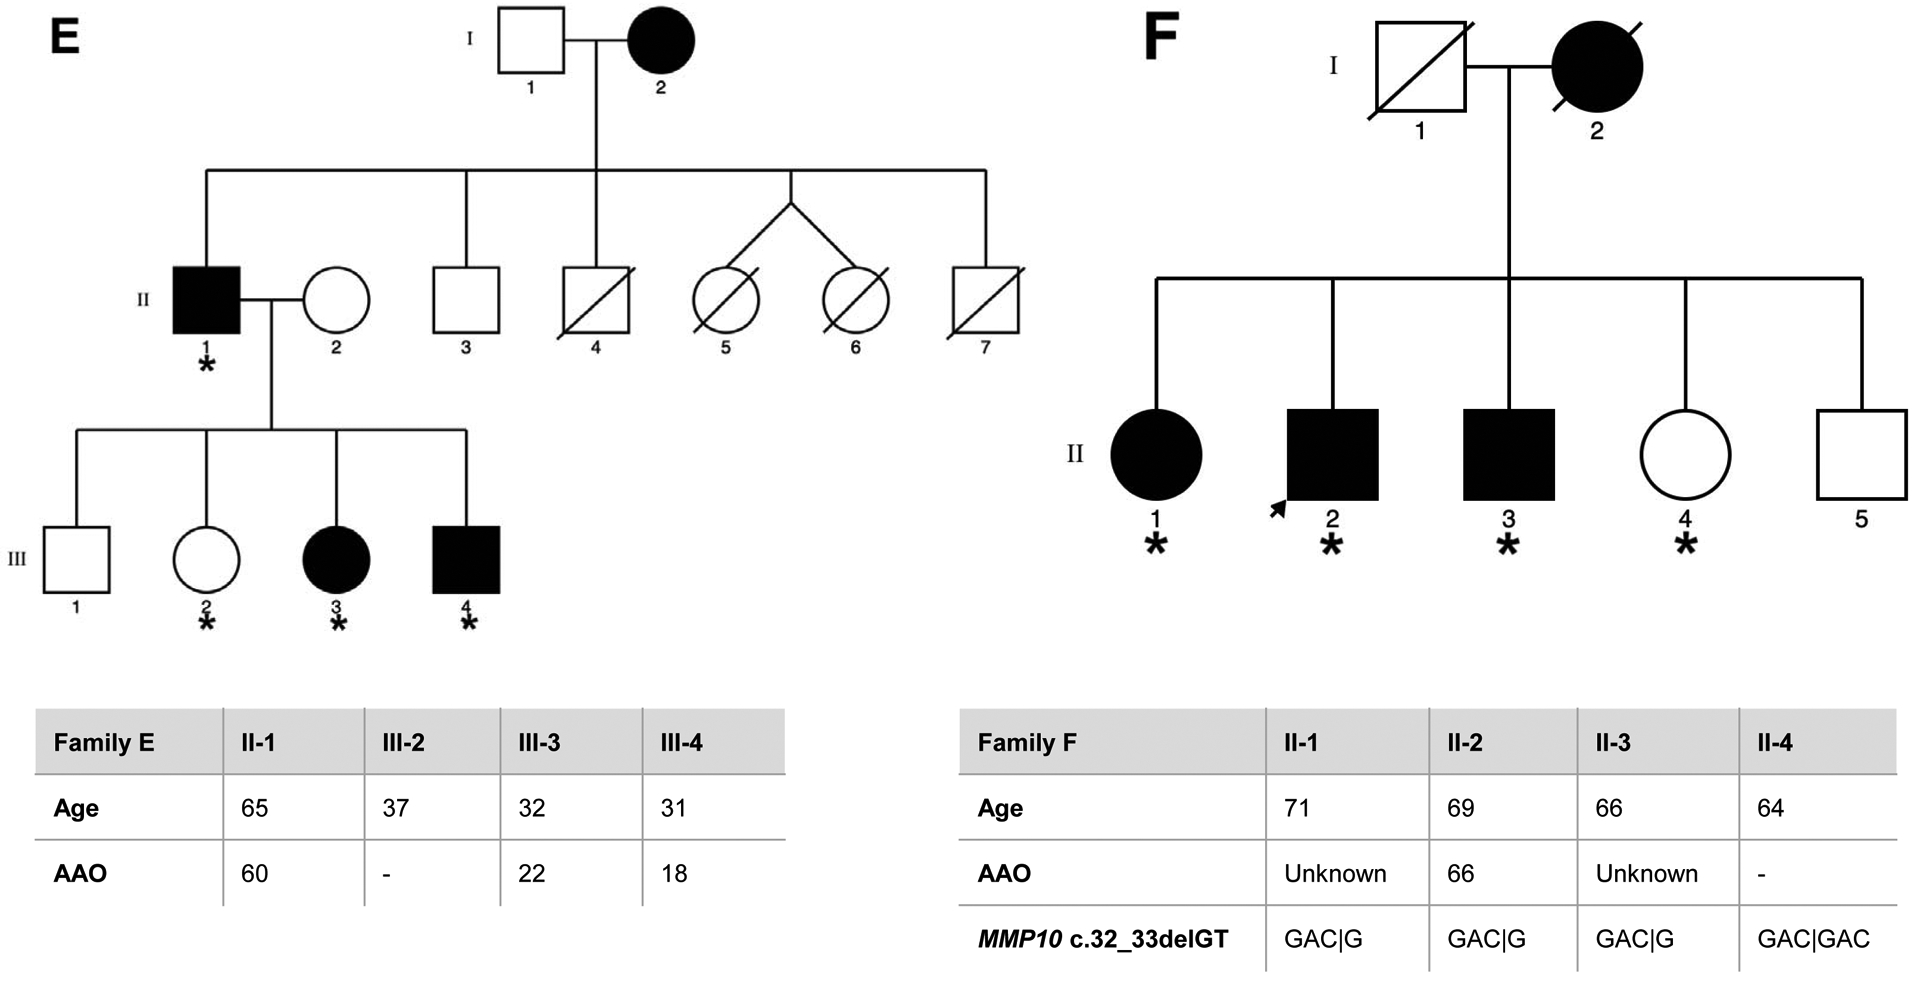
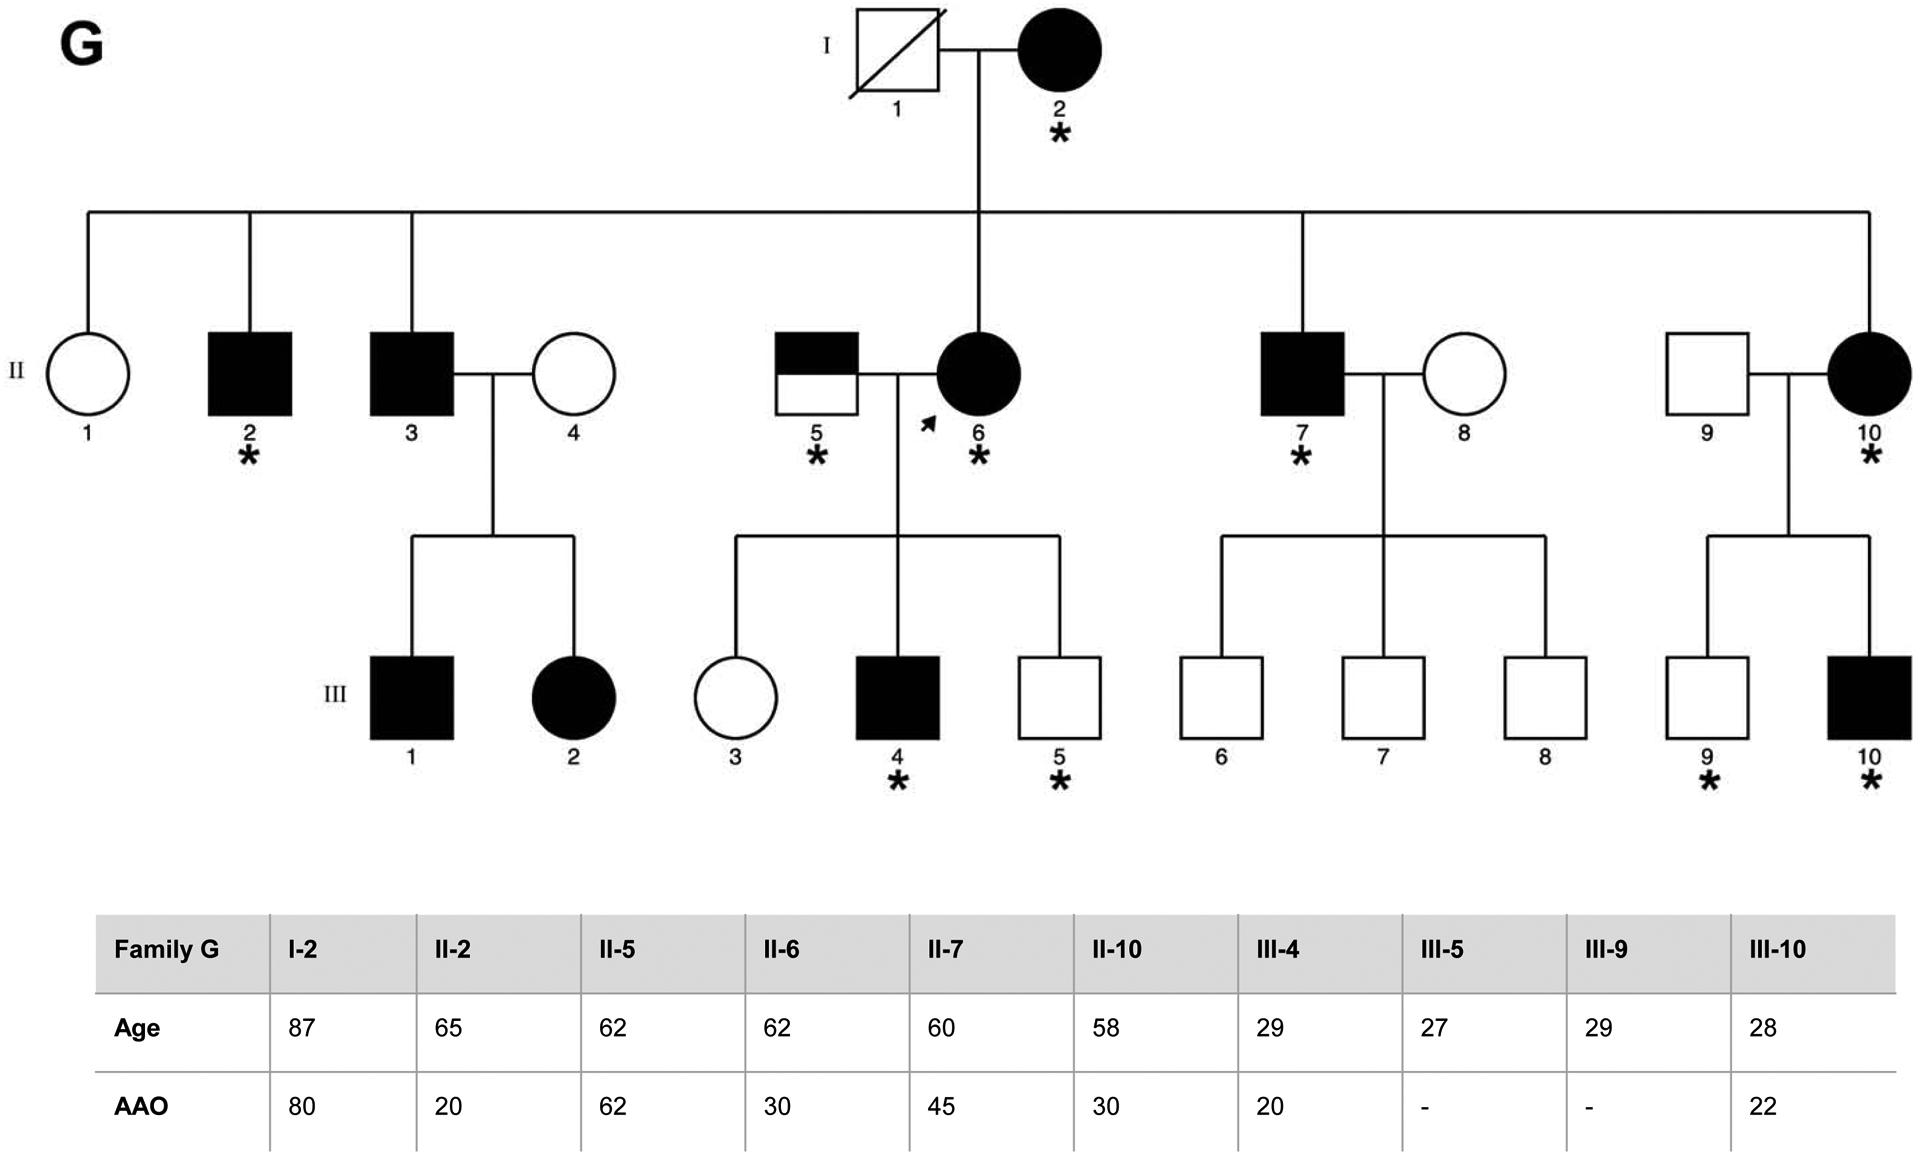
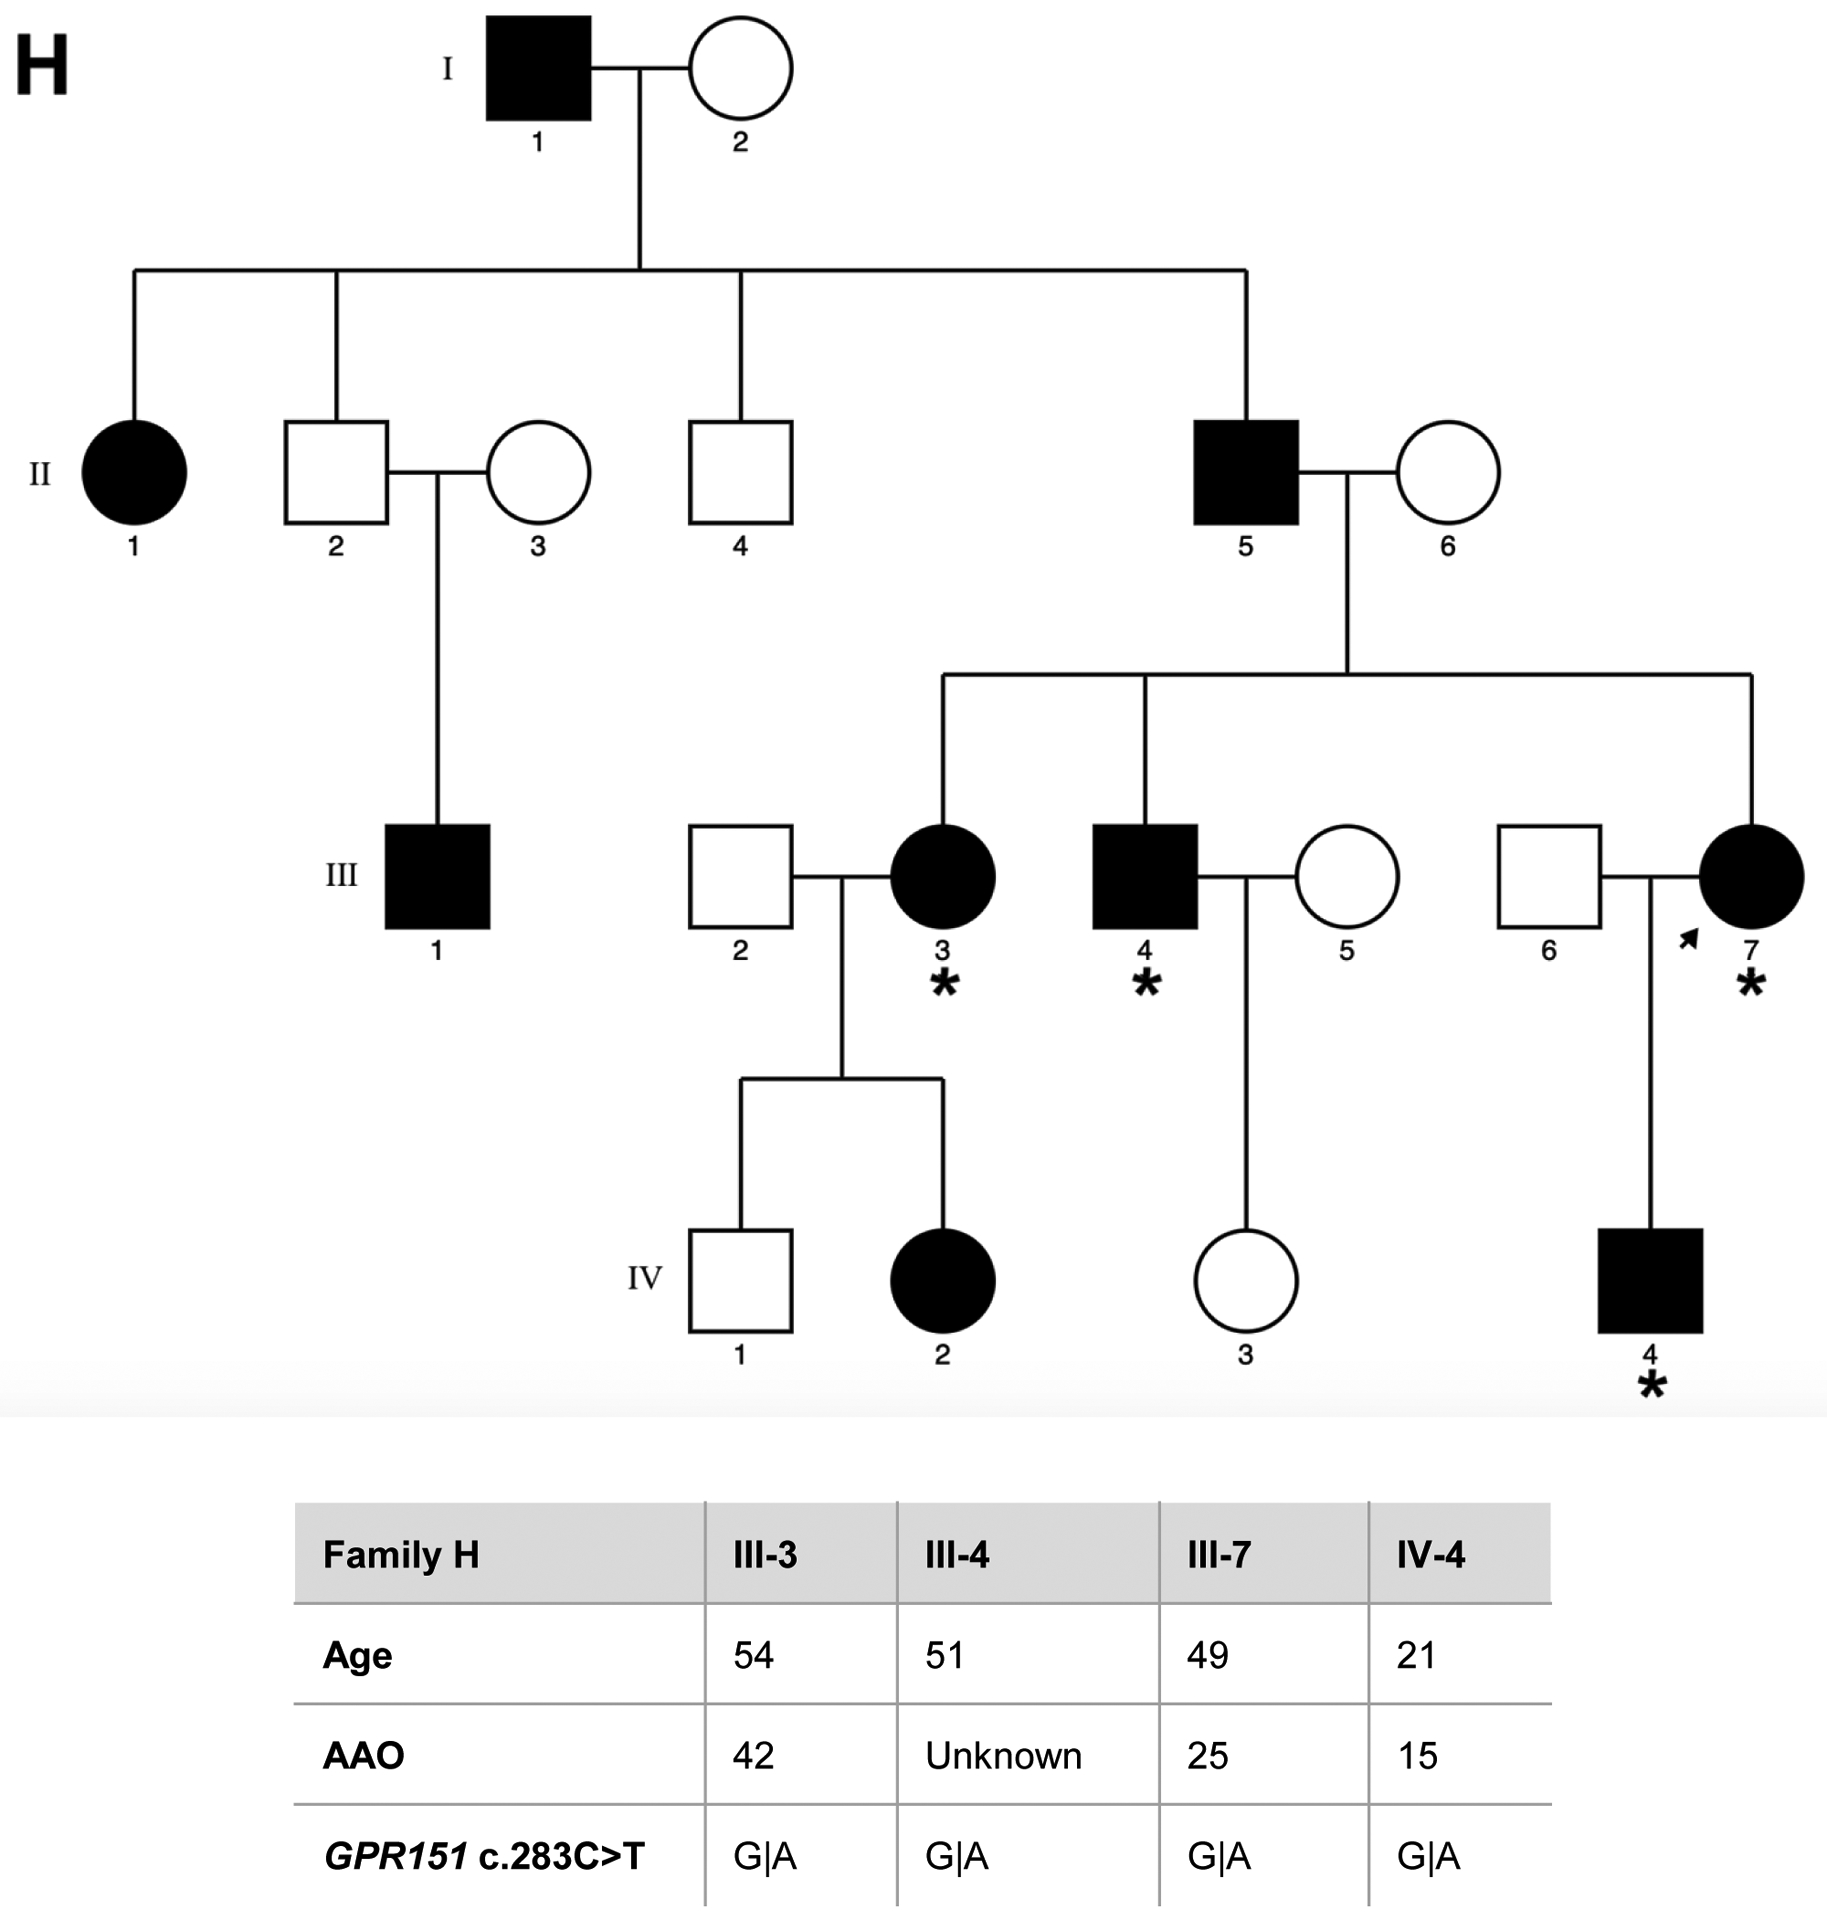
Genetic pedigrees plots of the eight families (A-H) included in the study are shown. The generation in each pedigree is indicated by roman numerals. The proband is indicated by an arrow. Red asterisk indicates those subjects that were exome sequenced (N=40). Below each pedigree, age at enrollment, age at tremor onset (for cases, if known), tremor region and severity are shown in a table. Tremor region (localization of the tremor): Head (H), Tongue (T), Chin (C), Upper limbs (UL), Lower limbs (LL). Tremor severity corresponds to scores in the Part A of the more affected body region according to the Fahn-Tolosa-Marin Clinical Rating Scale for Tremor (FTM) [41]. Shading legend: Symbols completely black indicate individuals with clinical definite ET diagnosis; Symbols half vertical black fill indicate individuals with unclear ET diagnosis; Symbols completely blank indicate unaffected individuals; Symbols with a diagonal line indicated deceased relatives. Segregation within families for the three candidate variants (rs749875462 in CCDC183, rs535864157 in MMP10 and rs114285050) is also shown in families A, F and H.
