
Fig 3. Galvanotaxis of primary CNCCs.
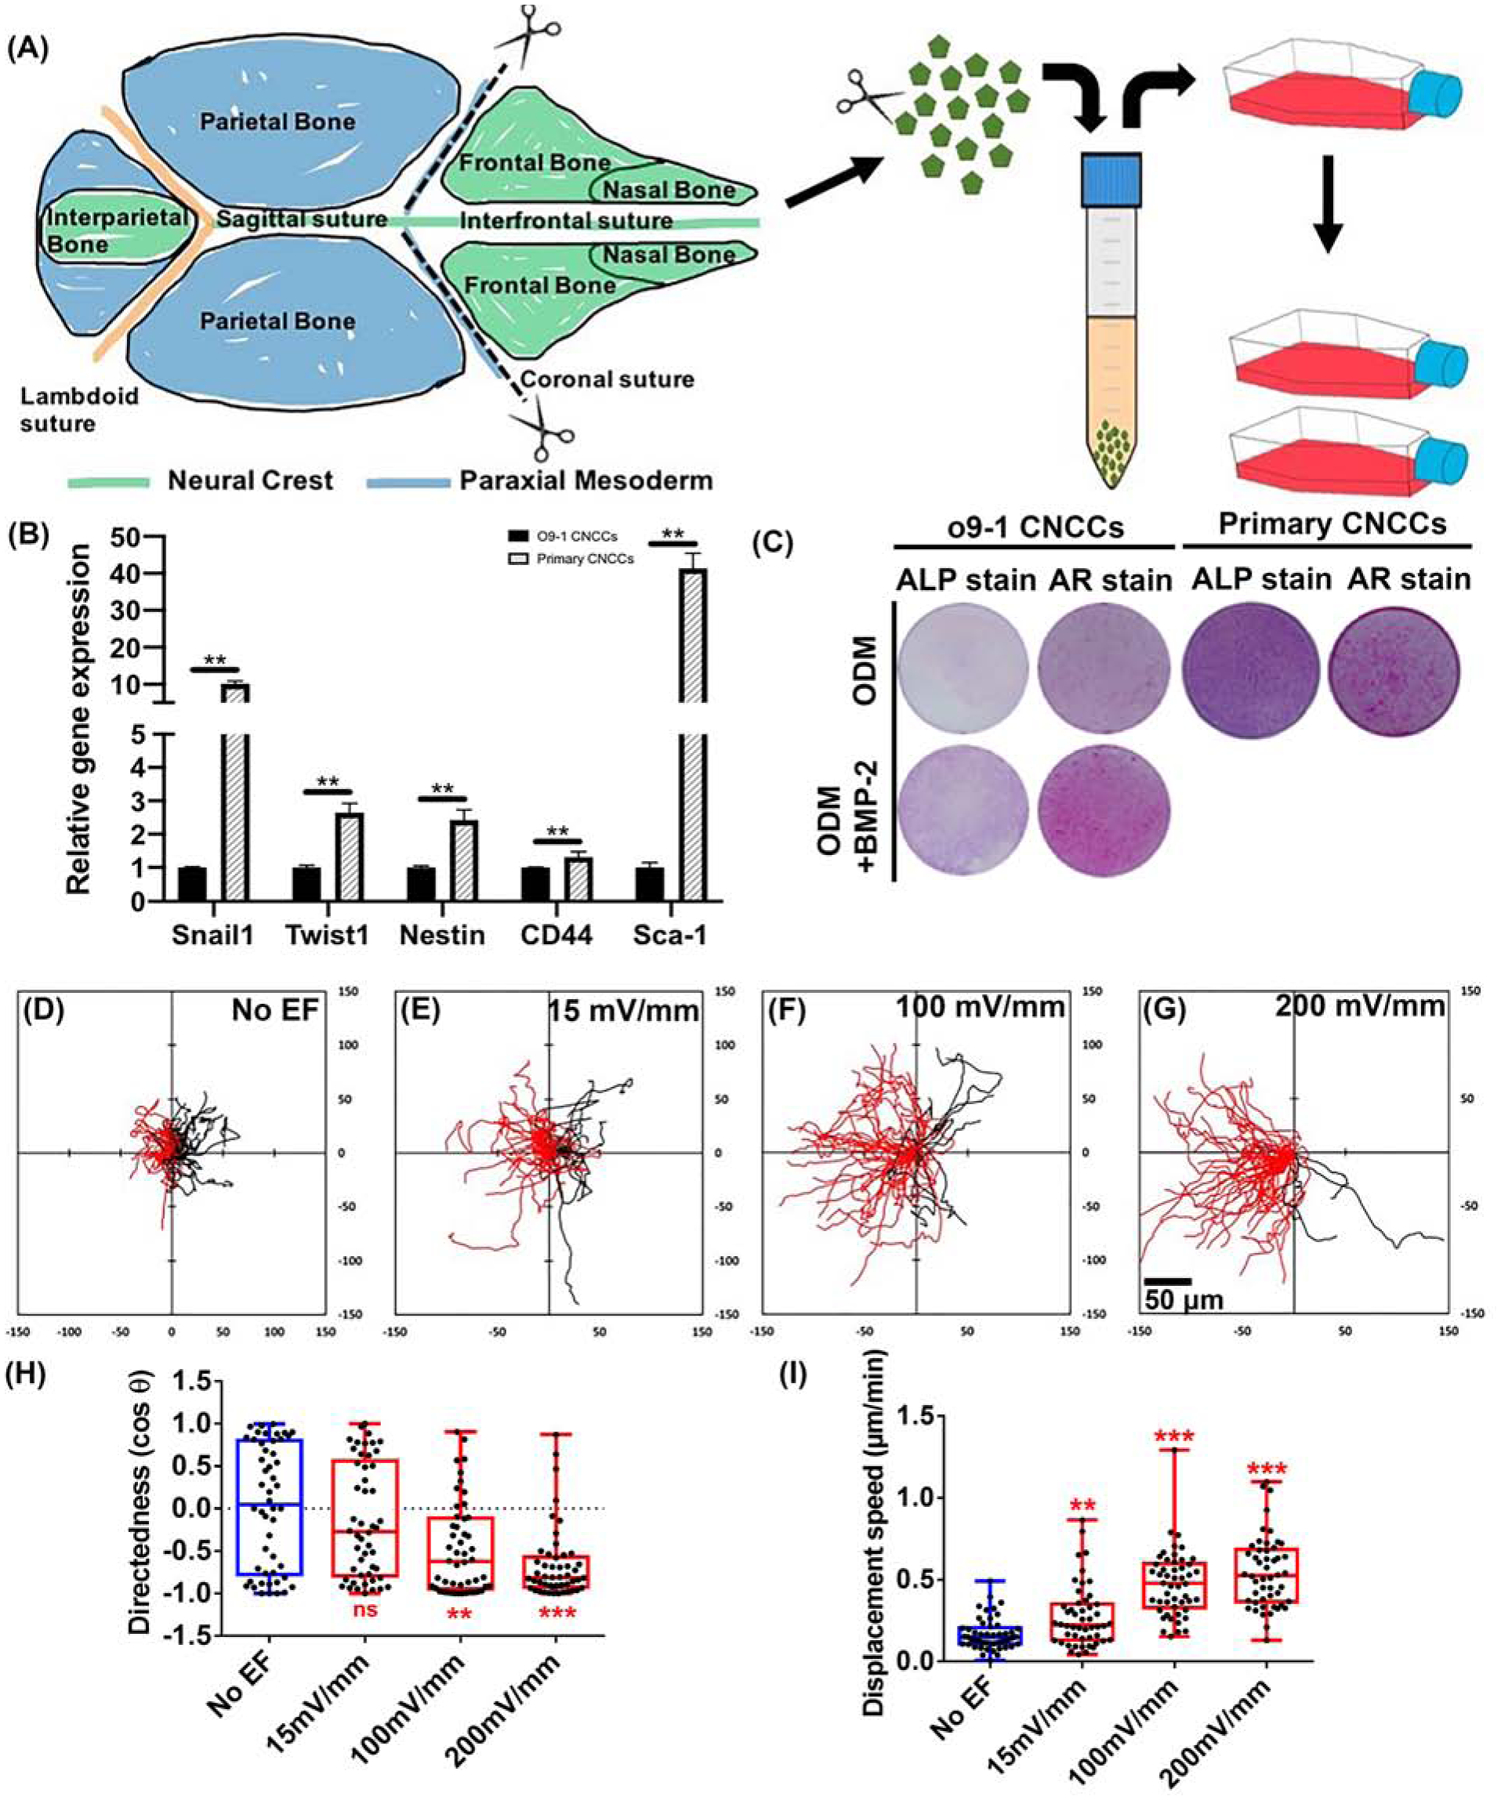
(A) Primary CNCCs were isolated from the frontal and nasal bones of neonatal mouse cranial vault (green part labeled). They were expanded in growth medium (passages 3–5). Cranial lineage of primary culture of CNCCs were validated by (B) RT-qPCR and (C) Osteogenic differentiation. (B) Gene expression of NCC markers (Snail1, Twist1, Nestin, CD44 and Sca-1) in primary NCCs was normalized to O9–1 CNCCs. N=3, each template underwent reverse transcription from an RNA pool of 3 experimental sets of cells. (C) Osteogenic differentiation of O9–1 and primary CNCCs were initiated by culturing the cells in osteogenic differentiation medium (ODM) (+/− 100ng/ml BMP2). ALP staining was performed on Day-7, and AR staining was performed on Day-21. Images are representative from triplicates of each group. (D–G) Migration trajectories. Cells migrate towards the anode to the left as shown in red, and towards cathode to the right in black. All cells started from the origin and migrated for 3 hours. (H) Applied EFs directed cell migration (I) increased displacement speed. *P<0.05, **P<0.01, *** P<0.001 when compared to the no EF control. Scale bar 50 μm.