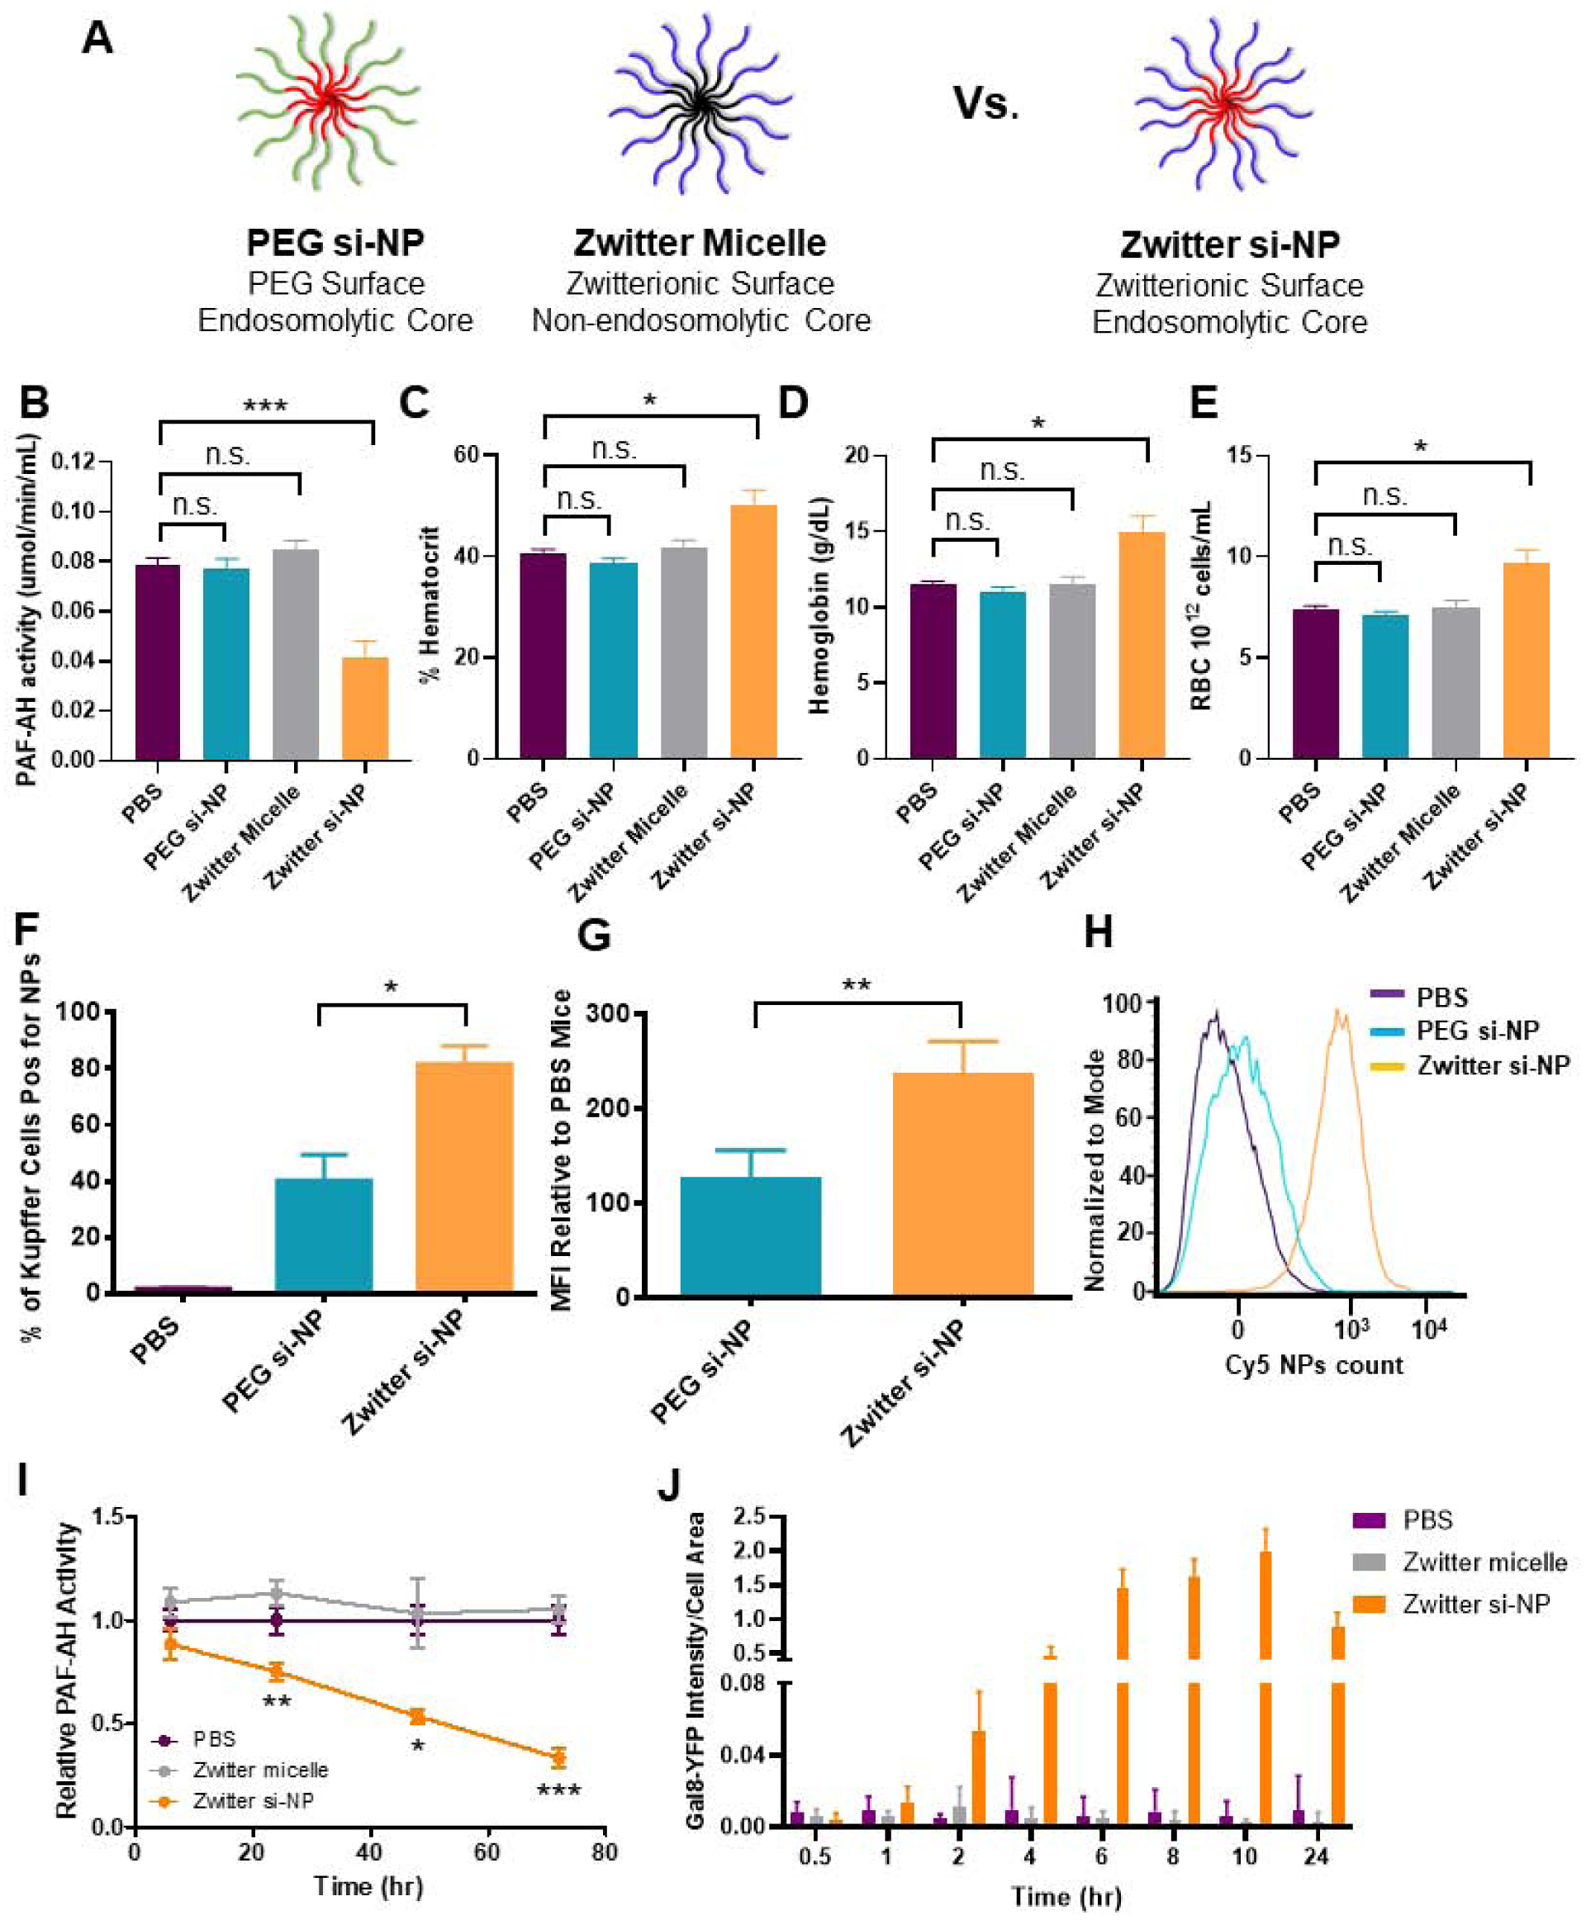
Figure 4. PAF-associated toxicities correlate with level of Kupffer cell delivery and are dependent on endosome-disruptive activity.

A) Schematic of zwitter si-NP, PEG si-NP, and zwitter micelle structures tested. B) Plasma PAF-AH activity from mice 15 min after receiving 1.2 mg/kg siRNA dose of each si-NP (n=4–5 per group, polymer dose: 73.6 mg/kg zwitter si-NP, 74.6 mg/kg PEG si-NP, 73.6 mg/kg zwitter micelle). Note that PBS and zwitter si-NP data are reiterated from Figure 2a. C-E) Hematocrit, hemoglobin, and red blood cell concentration values from mice 30 min after receiving a 1.2 mg/kg siRNA dose of each treatment. F) Percent of mouse liver Kupffer cells positive for Cy5 si-NPs 20 min after intravenous administration. G) Mean fluorescence intensity (MFI) of Cy5 PEG and zwitter si-NPs in mouse Kupffer cells relative to Kupffer cells of saline-treated mice (n=5). H) Representative histograms of Kupffer cell uptake of fluorescent si-NPs after intravenous delivery. I) PAF-AH activity in BMDM supernatants treated with 100 nM zwitter si-NPs or equivalent polymer concentration zwitter micelles. Significance indicated for differences between zwitter si-NP and zwitter micelle. J) Gal8 recruitment measured in GAL8-YFP expressing cells treated with 100 nM zwitter si-NPs or zwitter micelles. (* p<0.05, ** p<0.01, *** p<0.001).
