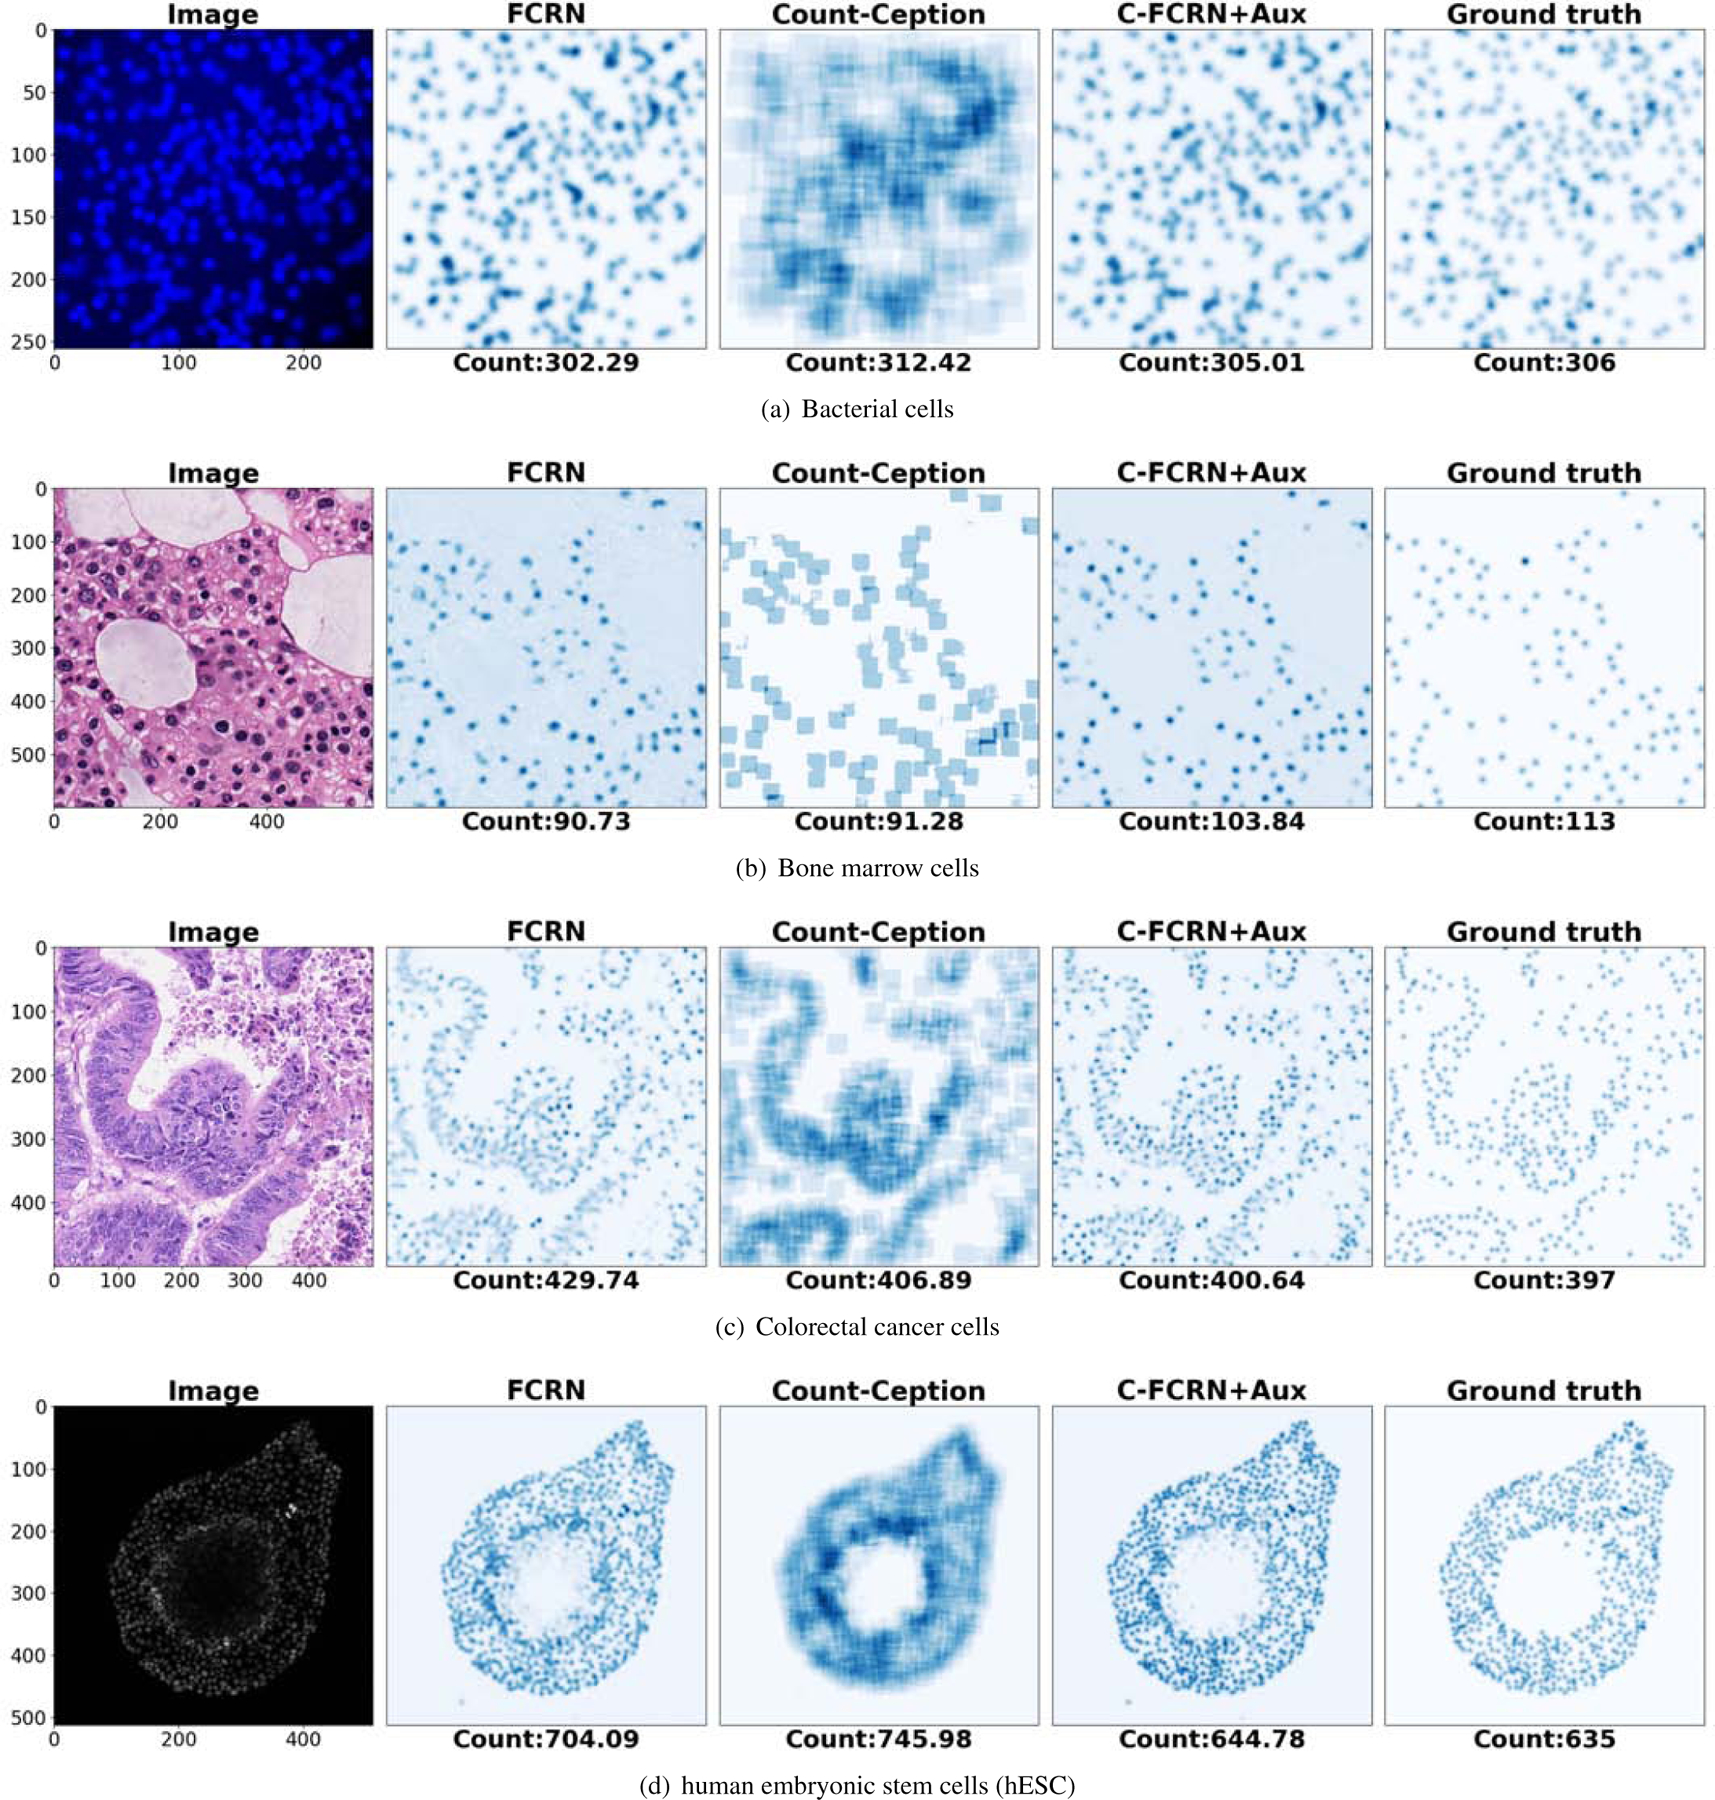
Figure 7.

Estimated density or count maps from a sample image in each of the four datasets. The panels from left to right on each row show the cell images and the density/count maps estimated by the FCRN, the Count-Ception, and the proposed method (C-FCRN+Aux), and the associated ground truth density maps, respectively.
