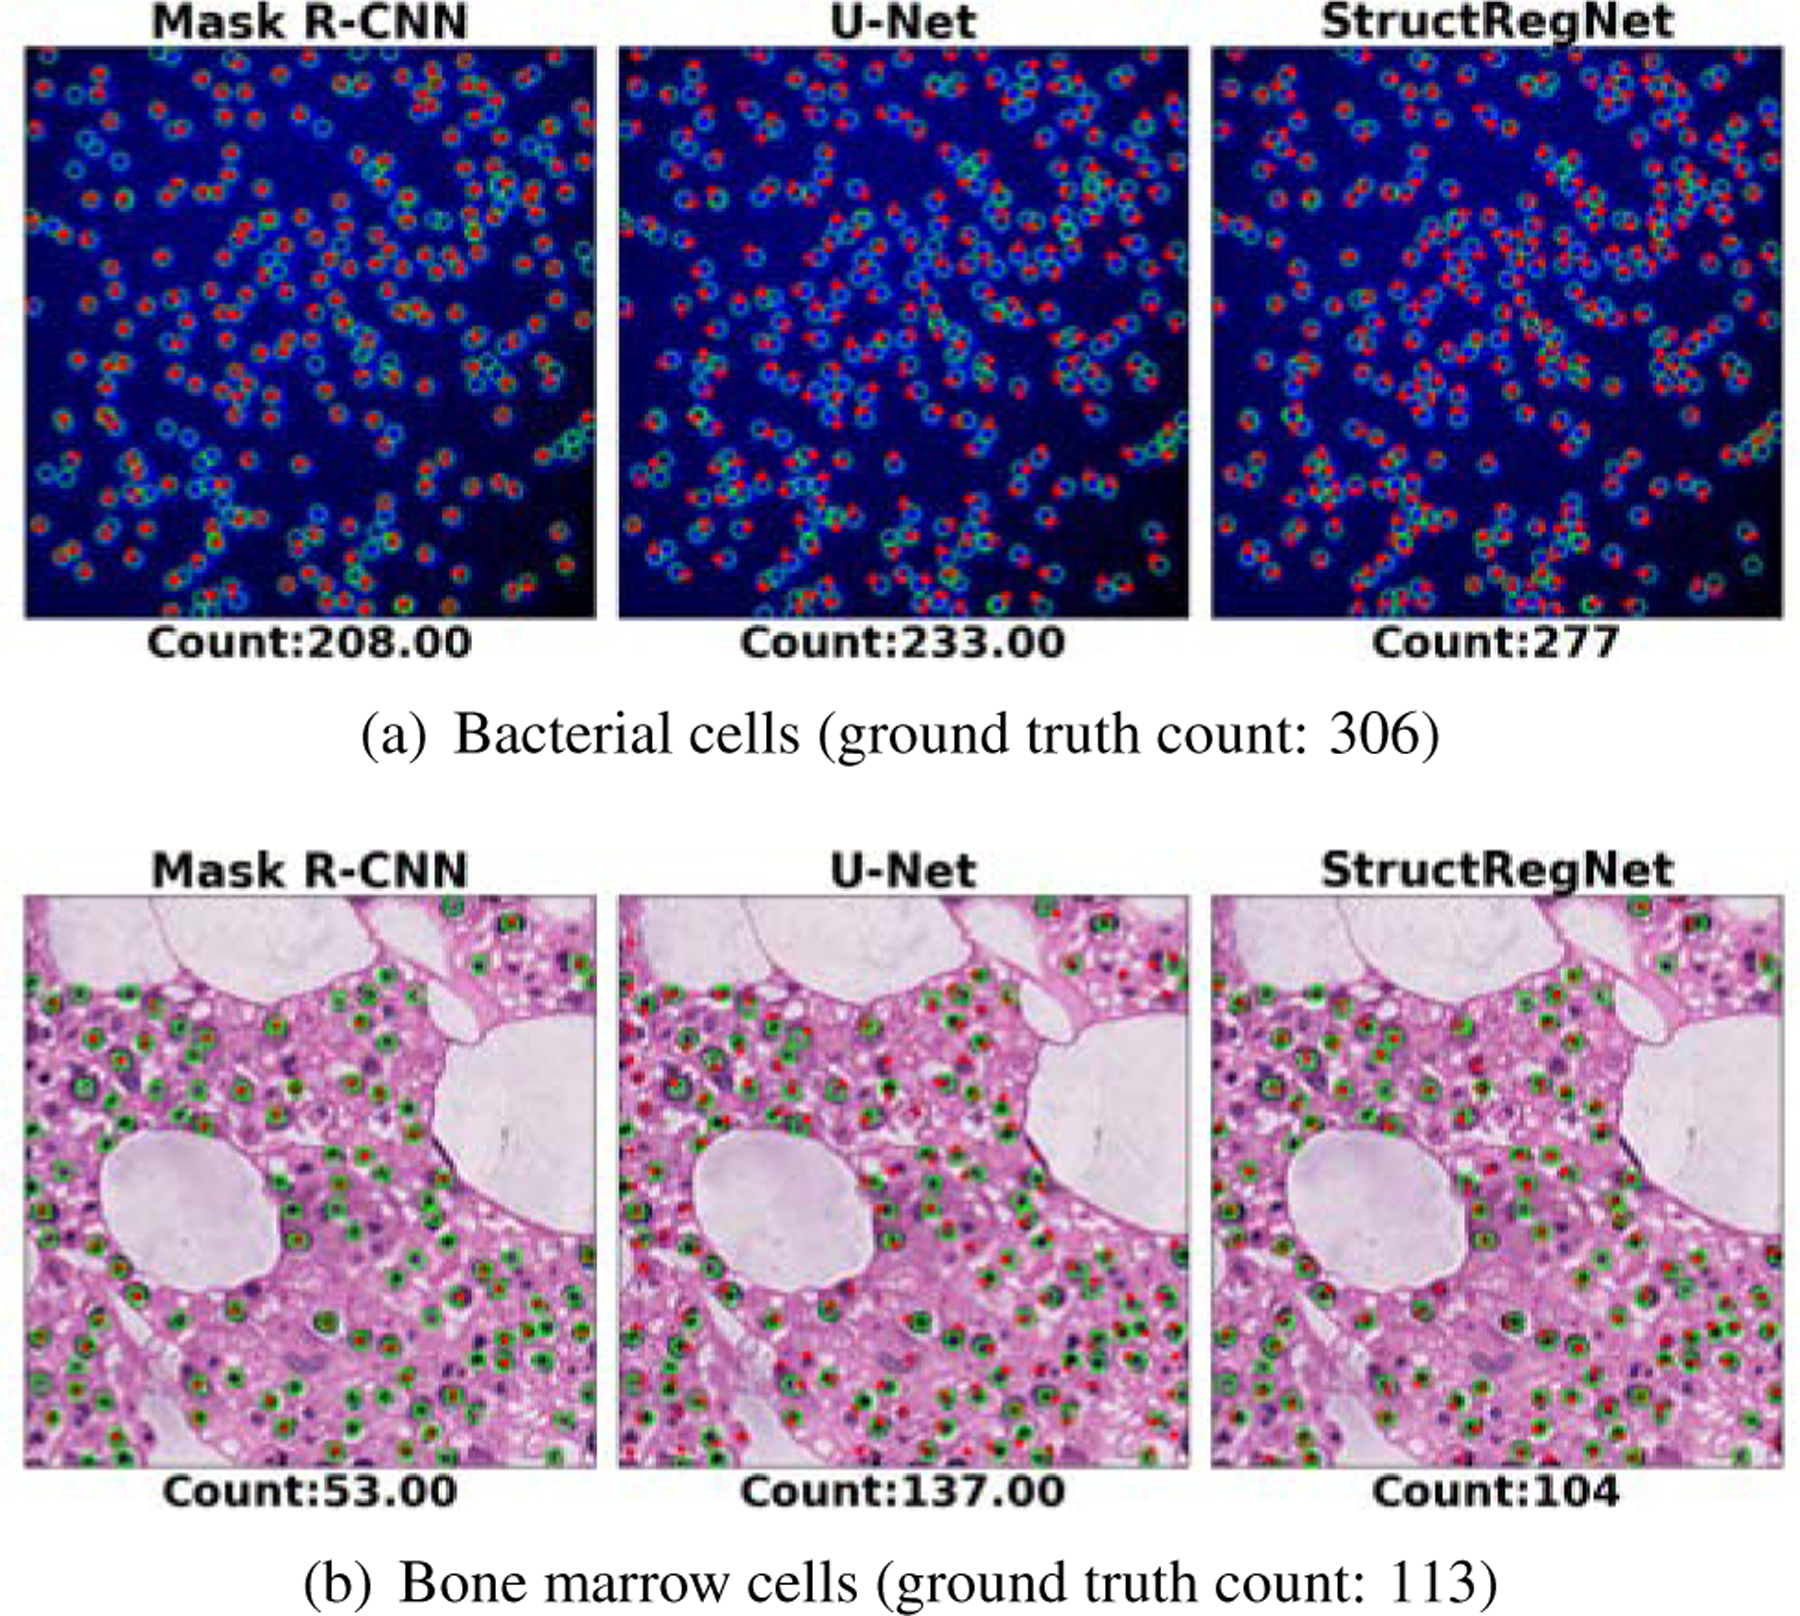
Figure 8.

Example results of three deep-learning detection-based cell counting methods (Mask R-CNN, U-Net, and StructRegNet). Panels (a) and (b) show the prediction results on the bacterial and bone marrow datasets, respectively. The green cycles and red dots in each image represent the ground truth annotations and the detected cell centroids, respectively.
