Fig. 5.
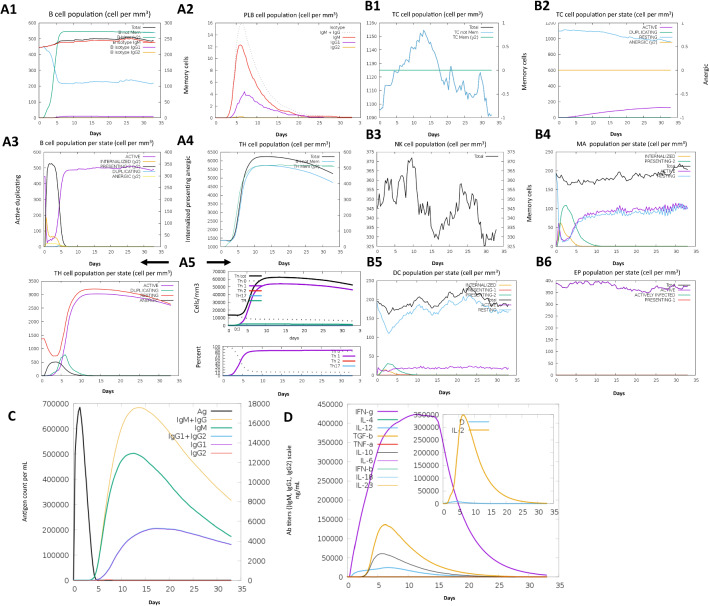
Immune simulation response to pathogens. The vaccine was administered over ~ 12 doses throughout ~ 12 months. The number of cells was displayed. Legend: Act (active), Intern (internalized) Ag, Press II posing MHC II, Dup (duplicating) in the mitotic cycle, Anergic residing was not active. a; 1 B-total count lymphocytes, memory cells and subdivided into IgM, IgG1 and IgG2 isotypes. a; 2 Plasma B-lymphocytes are subdivided by isotypes (IgM, IgG1 and IgG2). a; 3 B-lymphocytes population per entity state (i.e., displaying counts for involved, presenting on class II, internalizing the Ag, duplicating and anergic. a; 4 CD4 T-helper lymphocytes count. The plot compares the average number, and the memory counts. a; 5 CD4 T-helper lymphocytes count subdivided by entity state (i.e., involved, sleeping, anergic and duplicating). b Same symbols, as seen above. b; 1 CD8 T-cytotoxic count of lymphocytes and general information is seen. b; 2 CD8 T-cytotoxic count of lymphocytes as shown in the entity state. b; 3 Natural killer cells in total shown. b; 4 Complete count macrophages were internalized, indicating active and rested macrophages in MHC class II. b; 5 Dendritic cells. DC can present antigenic peptides for both class I and class II MHC molecules. Curves display the overall amount broken down to find, rest, internalizing, and addressing the Ag. b; 6 Complete epithelial cells broken down to acgive, virus-infected, and present in class I MHC molecules. c The virus, immunoglobulins and immunocomplexes. Antigen and immunoglobulin antibodies are subdivided by isotype. d Cytokine and interleukin concentrations. The inset plot displays the threat signal along with the leukocyte growth factor IL-2. Cytokines and related signals were seen for the concentration of cytokines and interleukins. D was a danger signal in the inset plot

