Figure 1.
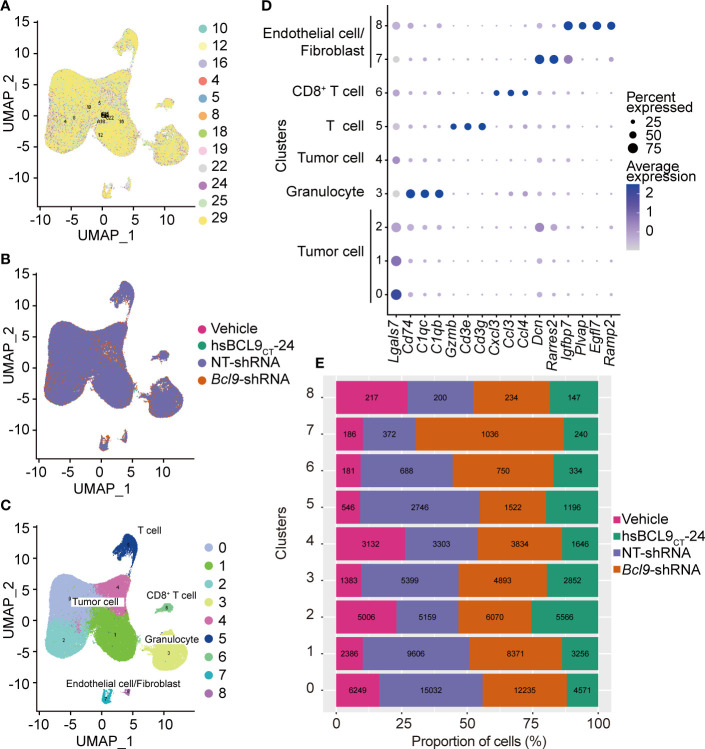
UMAP and cell cluster analysis. (A) UMAP of the samples profiled, and UMAP of the associated cell type. Color coded by their associated samples. (B) UMAP analysis of sample types of origin (vehicle, hsBCL9CT-24, NT, BCL9-shRNA). (C) UMAP of all cells profiled, and UMAP of the associated cell type and clusters. Color coded by their associated clusters. (D) Bubble chart of the eight clusters. (E) The fraction bar plot of eight clusters originating from vehicle, hsBCL9CT-24, NT, BCL9-shRNA (Numbers show real cell numbers).

