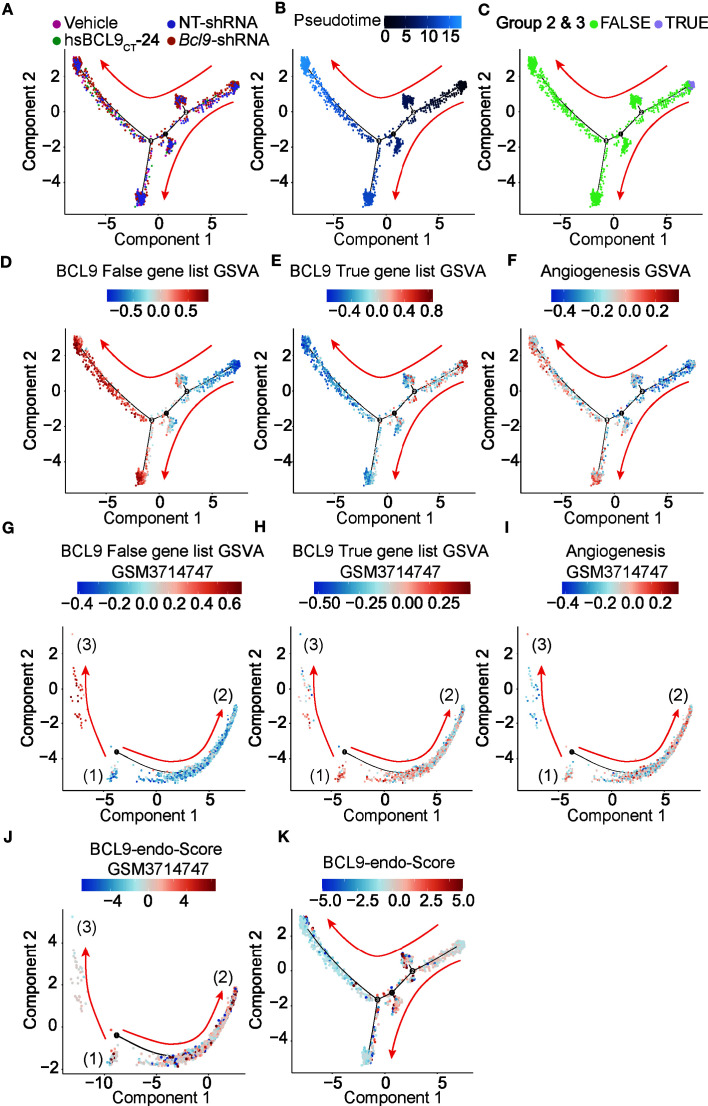
Figure 3.
Pseudotime analysis of endothelial cell. (A–F, K) Development trajectory of other types of endothelial cells and fibroblast populations along pseudo-time in two-dimensional space in vehicle, hsBCL9CT-24, NT, BCL9-shRNA. (G–J) Development trajectory of other types of endothelial cell population from published dataset (GSM3714747). Each point corresponds to a single cell and is color-coded by cell subgroup and differentiation score. Arrows indicate the direction of differentiation.

