FIG. 1.

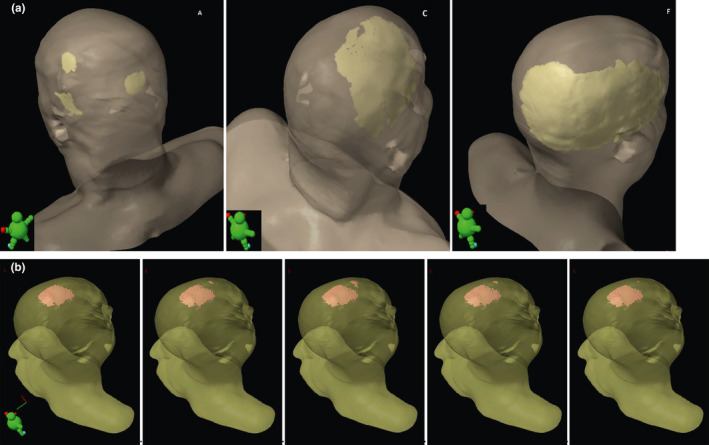
(a) Model view showing the V40 isodose distribution on the outer skin layer 0‐2mm for patients A (left), C (middle), and patient F (right). (b) Model view delineating the V40 isodose distribution on the outer skin layer 0‐2 mm for patient G. Scenarios 1 to 5 are shown from left to right
