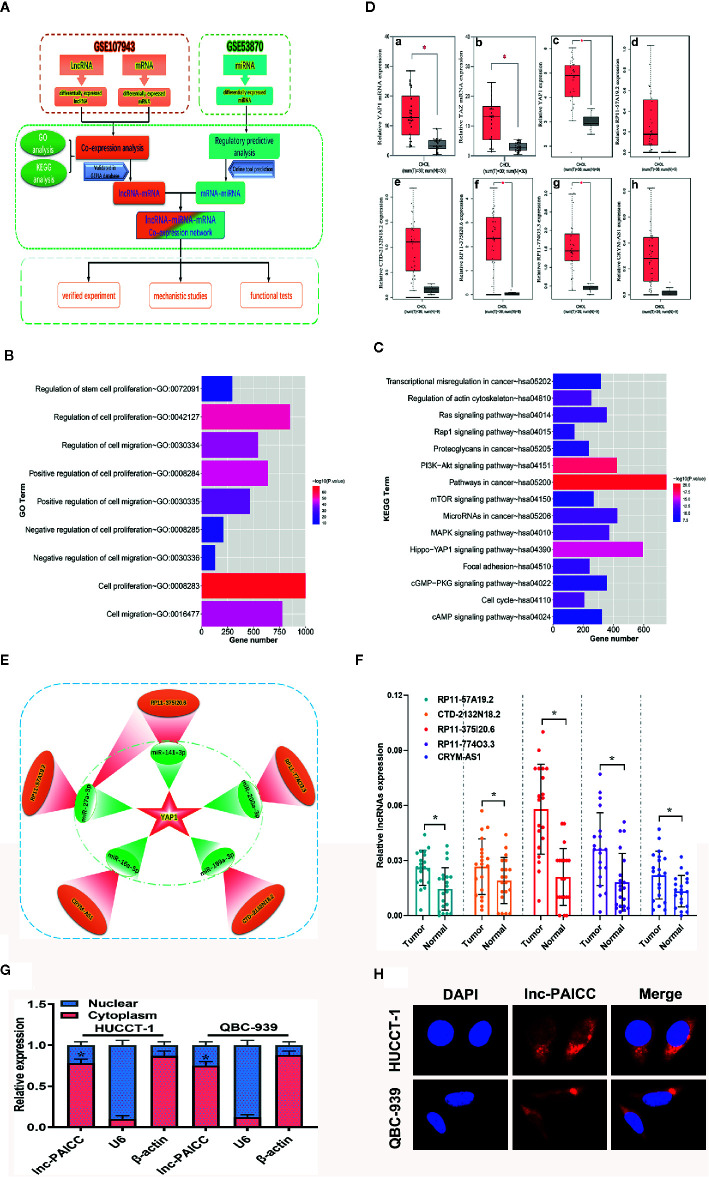
Figure 1.
Construction and validation of YAP1-related ceRNA regulatory networks for ICC. (A) Bioinformatics Analysis flow diagram. (B) GO annotation of differentially expressed genes. (C) KEGG analysis of differentially expressed genes. (D) (a) The relative expression level of YAP1 in the GSE107943 data set (comparison between cancer and corresponding normal tissue, *P<0.05); (b) The relative expression level of TAZ in the GSE107943 data set (comparison between cancer and corresponding normal tissue, *P<0.05); (c) The relative expression level of YAP1 in the GEPIA database (comparison between cancer and corresponding normal tissue, P < 0.05); c–h show the relative expression of six genes YAP1, lncRNA-RP11-57A19.2, lncRNA-CTD-2132N18.2, lncRNA-RP11-375I20.6, lncRNA- RP11-774O3.3, and lncRNA-CRYM-AS1 in the GEPIA database, respectively. (E) The schematic diagram of ceRNA network obtained by bioinformatics analysis. This subnetwork consists of five lncRNA (red) and five corresponding microRNA (green). (F) The differential expression of five candidate lncRNAs in 20 paired ICC and normal samples was examined by RT–PCR. Data are mean ± SD (n = 20), *P<0.05. (G) RT–PCR analysis of lncRNA-PAICC expression in HUCCT-1 and QBC-939 cells. β-actin and U6 were used as endogenous controls. Data are mean ± SD (n = 3). *P < 0.05. (H) Subcellular localization of lncRNA-PAICC by RNA-FISH in HUCCT-1 and QBC-939 cells.

