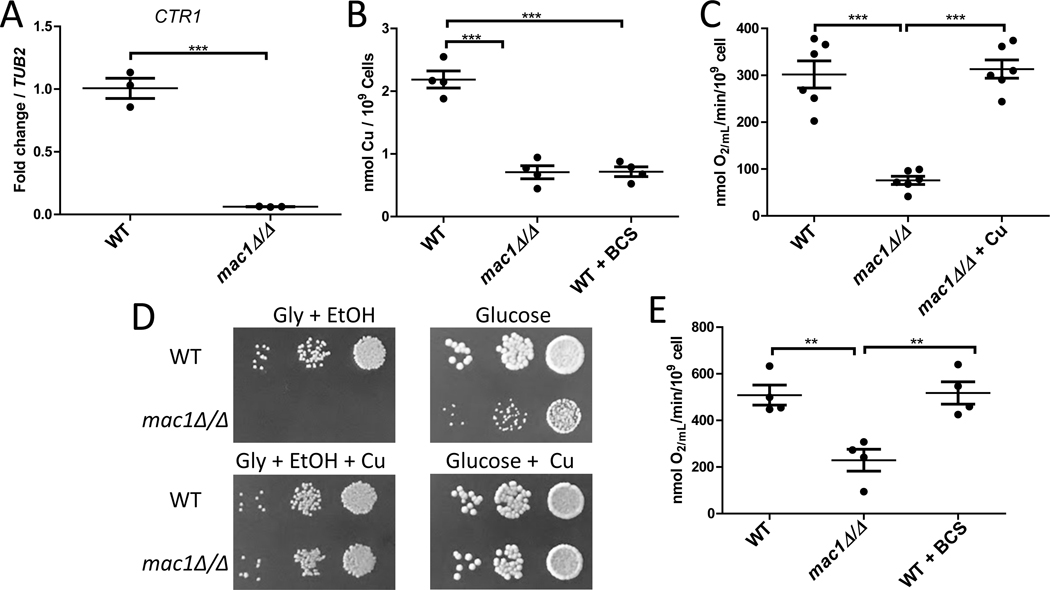
Figure 2. The Cu deficiency and respiratory defects of mac1Δ/Δ strains.
(A) Expression of CTR1 mRNA was analyzed by qRT-PCR and results normalized to TUB2. Results are shown for three independent cultures. Expression of CTR1 in the mac1Δ/Δ strain was significantly different as determined by two-tailed student’s T test (p=0.0003). (B) Total cellular Cu levels were measured by AAS in the indicated strains. Shown are the results of 4 independent cultures across 2 experimental trials. (C,E) KCN-inhibitable oxygen consumption was measured by a Clark-type electrode in the indicated strains. “+ Cu” and “+BCS” indicates cells cultured and assayed for oxygen consumption in the presence of 50 μM CuSO4 and 400 μM BCS, respectively. Results are from 4–6 cultures across 2–3 experimental trials. (D) 5 μL of a cell solution containing 0.01, 0.001, and 0.0001 OD600/mL of the designated strains were plated on YPGE (“Gly + EtOH”) or YPD (“Glucose”) plates. Where indicated, media was supplemented with 100 μM CuSO4. Statistical significance for B,C,E was determined by one way ANOVA with Tukey posttest; **p≤0.01, ***p≤0.001. The absence of a bracket indicates that comparisons are not significantly different. Strains utilized are as described in Fig. 1. With all the data points, the wide bar reflects the mean value and the standard error of the mean (SEM) is shown with error bars.

