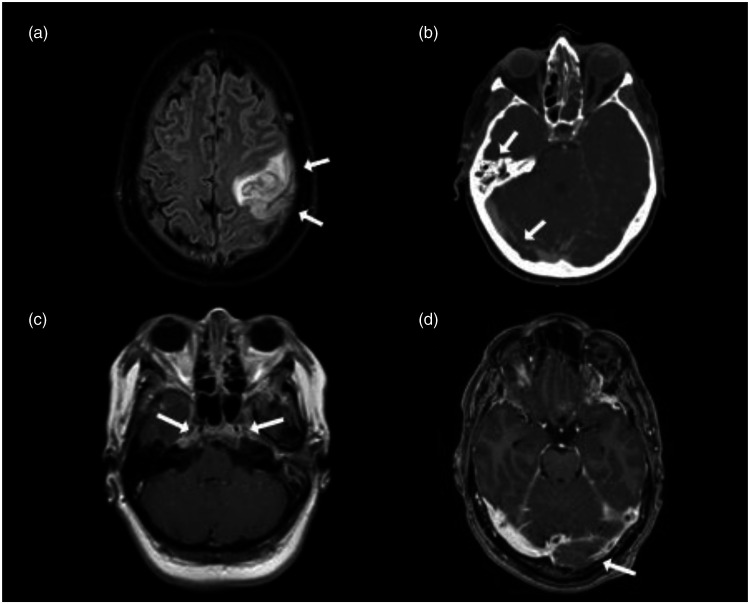
Figure 2.
Neuroimaging CVT. (a) MRI T2 Flair demonstrates venous infarction with secondary hemorrhage (arrow) of the left frontoparietal lobe in a patient with cortical vein thrombosis, (b) CT venography showing mastoid opacification (arrow) and right-sided transverse sinus thrombosis (arrow), (c) MRI T1 with enhancement shows bilateral pathological enhancement of the cavernous sinus (arrow) in a patient with cavernous sinus thrombosis, (d) MR venography demonstrates left-sided transverse sinus thrombosis (arrow).

