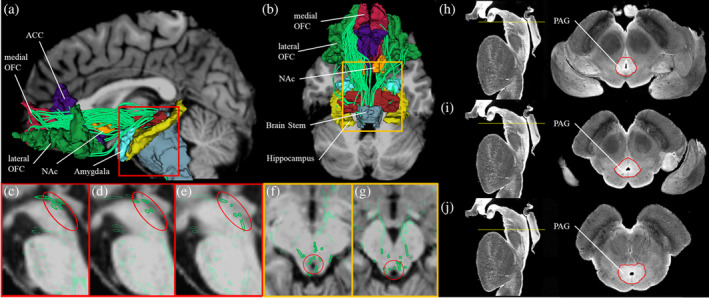
FIGURE 2.

Medial forebrain bundle. Three‐dimensional reconstructions of the medial forebrain bundle (MFB). MFB fiber tracts are in green. In the background, structural MRI in sagittal or axial view are given in shades of gray. (a) Sagittal view of the MFB. (b) Axial view of the MFB. (c–e) Sagittal view of a subset of fibers of the MFB in close relationship with the anatomical location of periaqueductal gray (PAG) (circled in red). (f–g) Axial view of a subset of fibers of the MFB in close relationship with the anatomical location of PAG (circled in red). (h–j) Representation of PAG in a high‐resolution data set as transverse segmented sections through the brainstem. For each subfigure, a sagittal view of the brainstem is shown on the left with a yellow line representing the plane of the section that corresponds to the axial view on the right panel. PAG is segmented as shown in the paper by Makris et al. (2019) using the Calabrese et al. (2015) high‐resolution brainstem dataset. ACC, anterior cingulate cortex; NAc, nucleus accumbens, OFC, orbitofrontal cortex,
