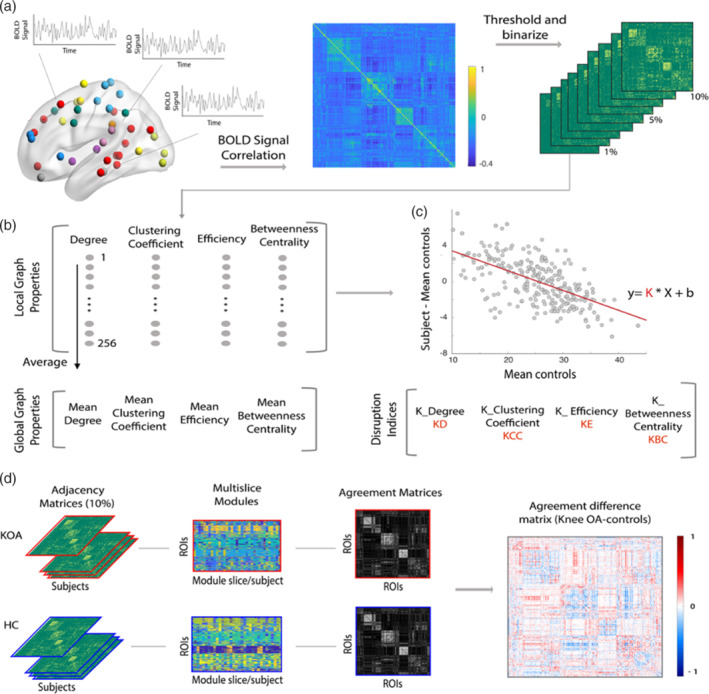
FIGURE 1.

Methodological overview of the computation pipeline for global and nodal graph properties, hub disruption indices and modular reorganization analysis. (a) For each subject included in the study, brain was parcellated in 256 regions of interest (ROIs) from a 264 parcellation Scheme (eight ROIs corresponding to the cerebellum were excluded). For each ROI, blood oxygenation level‐dependent signal (BOLD) was extracted as an average over voxels within 10‐mm diameter spheres with center at defined peak coordinate. Next, a 256 × 256 Pearson's full correlation matrix was computed between all pairs of ROIs time‐series; nine adjacency matrices were then calculated at different link densities (2–10%). (b) Graph properties (degree, clustering coefficient, efficiency, and betweenness centrality) were estimated using the Brain Connectivity Toolbox: First, we calculated nodal (local level) properties; latter, by averaging each property across the 256 ROIs we computed the corresponding global measurement. (c) Hub disruption indices were calculated for each subject as the gradient of a straight line fitted to a scatterplot of the nodal property of interest, for example, degree, minus the same nodal property on average in HC ([osteoarthritis [OA] patient—HC group], y‐axis), versus the mean nodal property in the HC group (x‐axis). (d) Modular reorganization was studied by calculating multislice modularity and agreement matrices separately for knee OA (KOA) and controls (agreement: 0 to 1). A difference agreement matrix was then considered, by subtracting controls agreement matrix to KOA (diff. agreement: −1 to 1). A positive entrance value (red) indicates higher likelihood for the two corresponding ROIs to be in the same module in KOA, but not in the control group. The opposite for negative entrance values (blue). Near zero values reveals pairs of ROIs that behave similarly in both groups. A permutational‐based random model was created by shuffling the two groups over 1,000 times, for further statistical testing
