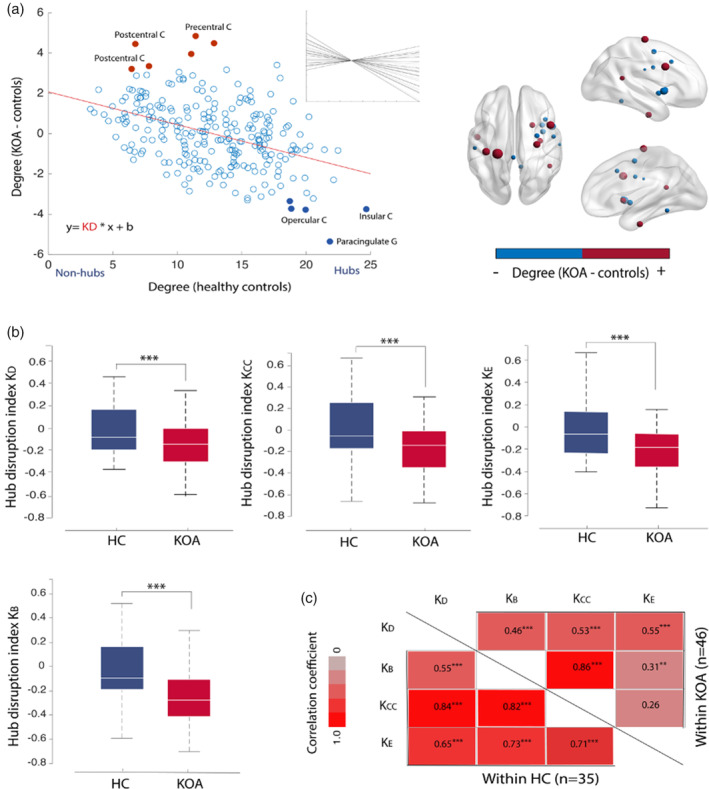
FIGURE 2.

Disruption of functional network hub organization in osteoarthritis (OA) patients. (a) Group hub disruption index calculation for degree (K D) at 5% link density: for each node (256 regions), the mean degree in the control group (x‐axis) is plotted against the mean nodal difference between groups (KOA—control) (y‐axis). Red dots represent nodes that are non‐hubs in controls but show an abnormal increase in degree in KOA patients: precentral and postcentral gyrus; filled blue dots represent nodes that are typically hubs in healthy controls and show a reduction in degree for KOA: insula; paracingulate gyrus; opercular cortex. The hub disruption index corresponds to the slope of the line fitted to the data (red line), K D = −0.18, p < .001. Insert shows individual K D values. On the right, brain graphical representation of the difference in mean degree between KOA and controls, top 10% most different regions of interest (ROIs) are depicted, red denotes abnormally increased degree and blue abnormally decreased degree in KOA compared to healthy controls. (c) Boxplots of the subject‐wise estimated hub disruption indices for the control group (blue) and KOA (red) at 5% link density. Between‐group differences in K D, K BC, K E, and K CC were deemed significant by an ANCOVA (p < .001), while controlling for age and gender. Corresponding results for the same measures different graph connection densities are shown in Figure S2. (d) The four hub disruption indices here significantly correlated with each other (Person's r), and the strength of correlation was overall higher in healthy controls than in KOA patients. ***p < .001; **p < .01; HC, healthy control; KOA, knee osteoarthritis
