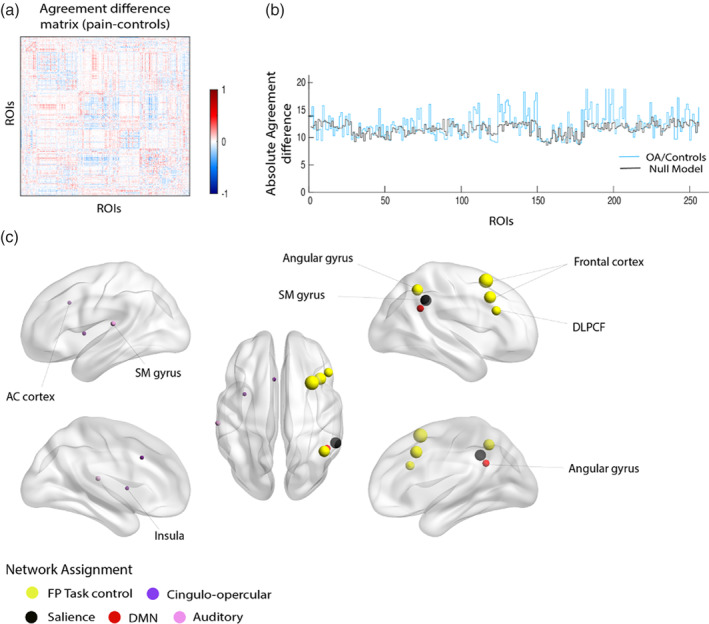
FIGURE 5.

Modular reorganization in osteoarthritis (OA) involves predominantly nodes assigned the frontoparietal and cingulo‐opercular task control networks. (a) Agreement difference matrix obtained from the difference between the modular agreement matrix from OA and control groups. Positive (red) values reflect pairs of nodes that are estimated to appear more commonly in the same module in OA patients, and negative (blue) values represent pairs of nodes that are estimated to appear less commonly in the same module in OA. White value represents regions of interest (ROIs) that has the same behavior in both groups. (b) Blue line shows overall modular reorganization for each node as the sum of both positive and negative values for each node (sum of absolute value per row in (a)), meaning the largest value, the greater reorganization. To statistically evaluate these values, we performed a permutation test of sum reorganization estimation (null model, gray color), yielding one‐side p‐values across all ROIs. (c) Representation of statistically significant nodes showing modular reorganization at a threshold of p < .01; size reflects magnitude of the absolute agreement difference
