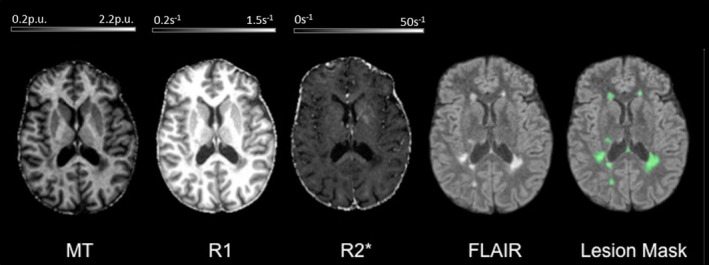
FIGURE 1.

Example of MPM quantitative maps for a specific MS patient. From left to right: 3 MPM quantitative maps (MT, R1, R2*), standard FLAIR sequence image and FLAIR image overlaid with the estimated lesion mask. MT, magnetization transfer saturation; R1, longitudinal relaxation rate (1/T1); R2*, effective transverse relaxation rate (1/T2*); Lesion mask, posterior probability map of lesion tissue thresholded at 90%
