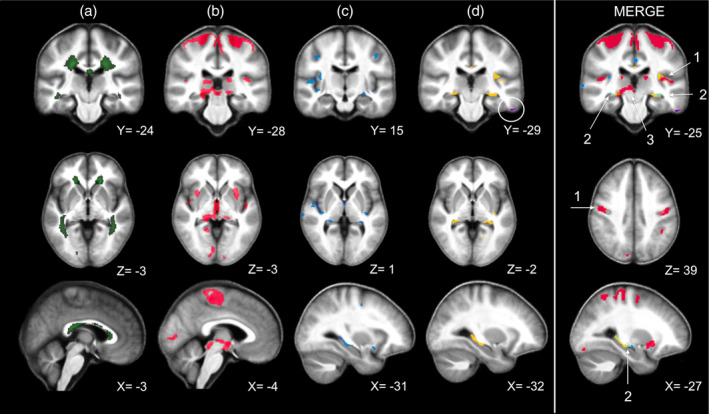
FIGURE 2.

VBM and VBQ results superimposed on the group mean MT map. Green: Average WM lesion probability map of MS patients, thresholded at 90% (a); Voxels showing a significant difference between MS and HC (thresholded at cluster level, p < .05 FWER‐corrected): decreased gray matter (GM) volume in red (b), MT reduction in blue (c), R1 reduction in yellow and R2* reduction (circled) in violet (d). The right most column (MERGE) overlays the maps displayed in columns b, c, and d columns, same color scheme, and highlights the three different patterns discussed in the main text (1 = Primary Neocortical Regions, 2 = Hippocampus, 3 = Deep Gray Matter Nuclei). Images are shown in neurologic convention and the X/Y/Z coordinates indicate the slice position in millimeter in MNI space
