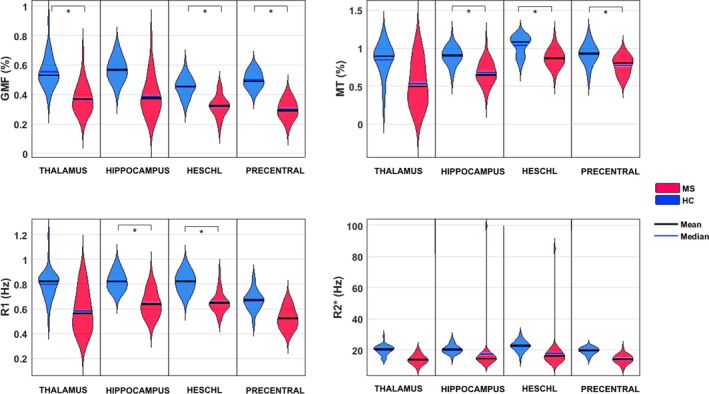
FIGURE 3.

Illustration of the distribution of each GM parameter (GM volume, MT, R1, R2*) extracted from four different voxels, across MS and HC subjects in four brain regions of interest: Left thalamus (x = −15, y = −27, z = 14); Left hippocampus (x = −31, y = −27, z = −7); Left Heschl's gyrus (x = −37, y = −28, z = 10); Left precentral gyrus (x = −34, y = −6, z = 46). All voxels coordinates expressed in MNI space and chosen as the local statistical maximum in the ROI. Statistical significance (*) set at p < .05 FWER‐corrected for the whole GM volume
