FIGURE 3.

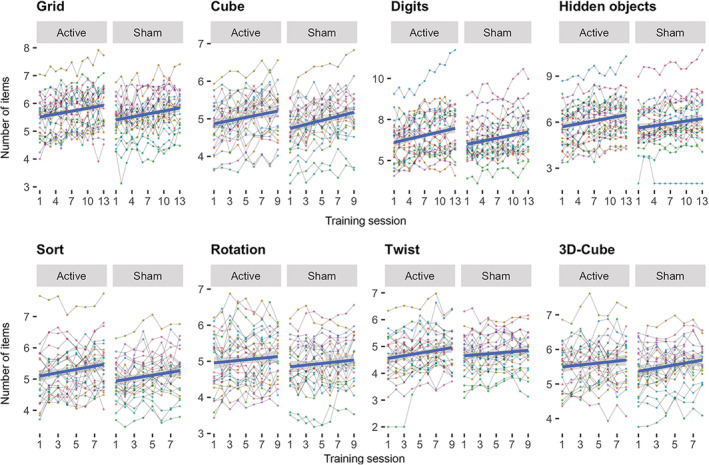
Individual level task performance during the course of the intervention period for each group (tDCS sham/active). The fit lines are based on a linear fit within each group

Individual level task performance during the course of the intervention period for each group (tDCS sham/active). The fit lines are based on a linear fit within each group