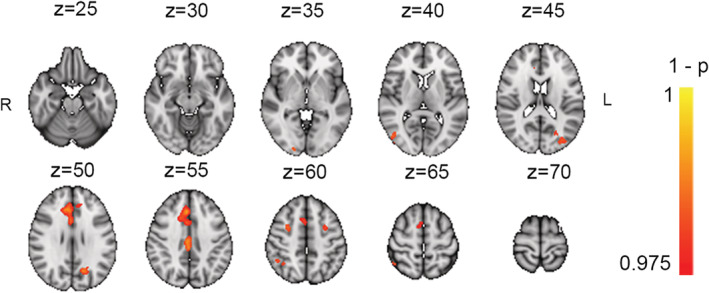
FIGURE 7.

Association between Cogmed average performance score, and difference in task‐related activation (L1 & L2 > PV) between Timepoints 3 and 2

Association between Cogmed average performance score, and difference in task‐related activation (L1 & L2 > PV) between Timepoints 3 and 2