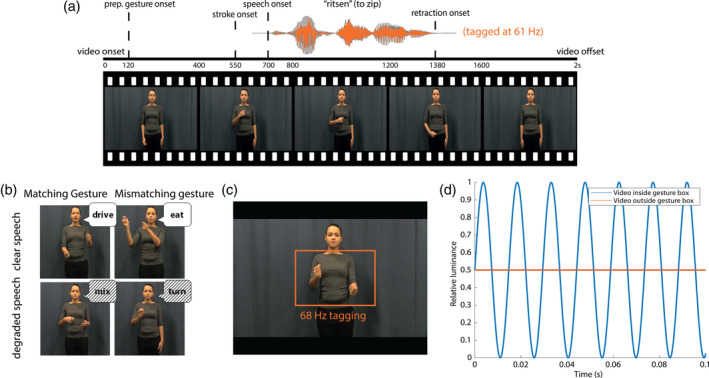
FIGURE 1.

(a) Illustration of the structure of the videos. Speech was amplitude‐modulated at 61 Hz. (b) Illustration of the different conditions. (c) Area used for visual frequency tagging at 68 Hz. (d) Illustration of luminance manipulation for visual‐frequency tagging. Frequency tagging was achieved by multiplying the luminance of the pixels with a 68 Hz sinusoid. Modulation signal was equal to 0.5 at sine wave zero‐crossing to preserve the mean luminance of the video, and was phase‐locked across trials
