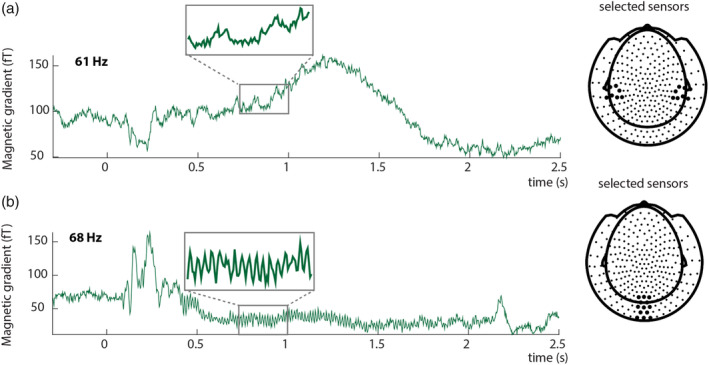
FIGURE 3.

Event‐related fields show clear responses at the tagged frequencies. Auditory input was tagged by 61 Hz amplitude modulation (a), Visual input was tagged by 68 Hz flicker (b). The insets reflect an enlarged part of the signal to clearly demonstrate the effect of the tagging on the event‐related fields. Tagging was phase‐locked over trials. (a) Average ERF for a single subject at selected sensors overlying the left and right temporal lobe. The highlighted sensors in the right plot reflect the sensors for which the ERF is plotted. (b) Average ERF for 68 Hz for a single subject at selected sensors overlying occipital cortex. The highlighted locations in the right plot reflect the sensors for which the ERF is plotted. ERFs show combined planar gradient data
