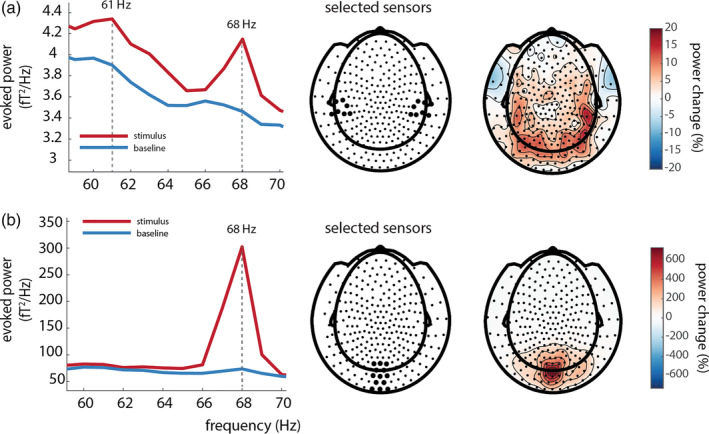
FIGURE 4.

(a) Power over auditory sensors peaks at the tagged frequency of the auditory stimulus (61 Hz). Note the visual 68 Hz tagged signal is still observable at left‐ and right‐temporal sensors of interest; 61 Hz power is stronger in the stimulus interval than in the baseline interval, and is widely spread over posterior regions, with maxima at right‐temporal regions. (b) A power increase is observed at the tagged frequency (68 Hz) for the visual stimuli; 68 Hz power is larger in the stimulus than in the baseline window and is strongest over occipital regions
