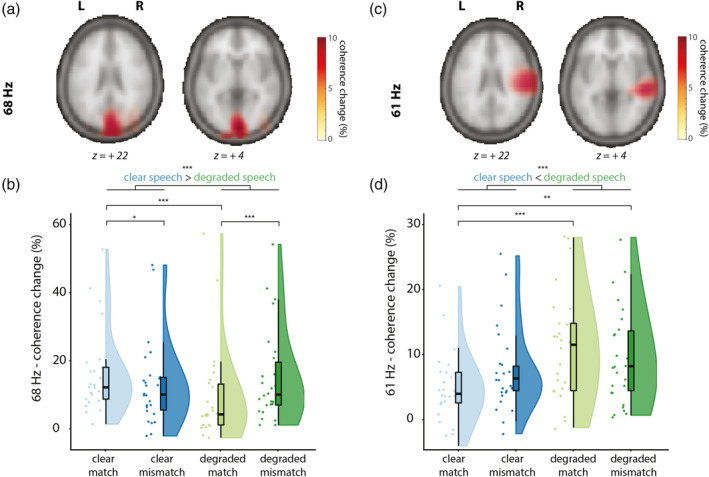
FIGURE 5.

Sources of the visually tagged signal at 68 Hz (A/B) and sources of the auditory tagged signal at 61 Hz (C/D), and individual scores in the respective ROI per condition (clear match/clear mismatch/degraded match/degraded mismatch. Z‐coordinates of slices are in mm and in MNI space. (a) Coherence change in percentage when comparing coherence values in the stimulus window to a poststimulus baseline for 68 Hz (the frequency of the visual tagging), pooled over conditions. Only positive coherence change values are plotted (>80% of peak maximum). Coherence change is the largest over occipital regions for the visually tagged signal. (b) Coherence change values in percentage extracted from the 68 Hz ROI. Raincloud plots reveal raw data, density, and boxplots for coherence change. (c) Coherence change in percentage when comparing coherence values in the stimulus window to a poststimulus baseline for 61 Hz (the frequency of the auditory tagging), pooled over conditions. Only positive coherence values are plotted (>80% of peak maximum). Coherence change is largest over right‐temporal regions. D: Coherence change values in percentage extracted from the 61 Hz ROI. Raincloud plots reveal raw data, density, and boxplots for coherence change
